
PUBLISHER: Mordor Intelligence | PRODUCT CODE: 1842709

PUBLISHER: Mordor Intelligence | PRODUCT CODE: 1842709
Private Equity - Market Share Analysis, Industry Trends & Statistics, Growth Forecasts (2025 - 2030)
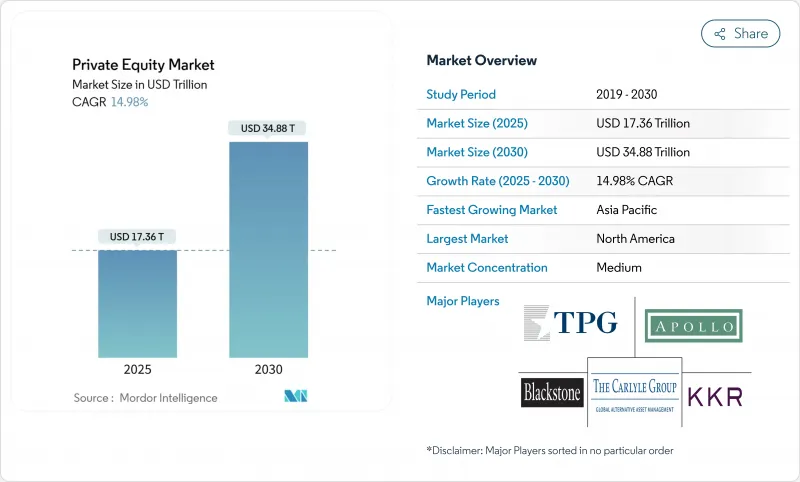
The global private equity market stood at USD 17.36 trillion in 2025 and is forecast to reach USD 34.88 trillion by 2030, reflecting a 14.98% CAGR.
This growth trajectory underscores how the private equity market has evolved from a specialist asset class into a mainstream capital-allocation channel that rivals public markets. Limited partners reinforce this expansion by boosting commitments as traditional fixed-income yields remain muted. Record dry-powder balances above USD 2 trillion, a widening supply of corporate carve-outs, and rising interest in energy-transition assets are sustaining deal flow despite a higher-rate environment. Regulatory shifts are also important; while AIFMD II tightens transparency in Europe, new semi-liquid vehicles and 401(k) inclusion in the United States are unlocking large retail pools. Paradoxically, rate normalization has thinned speculative leverage buyers, giving well-capitalized sponsors a clearer field to acquire quality assets.
Global Private Equity Market Trends and Insights
Record Dry-Powder Balances Seeking Deployment
Global dry powder climbed to USD 2.62 trillion by mid-2024, applying material pressure on general partners to transact. Investment committees are accelerating diligence timelines and underwriting higher entry multiples to avoid capital drag. The result is a sharper bifurcation: mega-funds gravitate to multibillion-dollar public-to-private deals, whereas specialist mid-market managers see less bidding congestion and tighter pricing. In sectors such as healthcare services and B2B software, abundant capital pushes sellers to test the market sooner, reinforcing a virtuous cycle of deal supply. Yet aging vintage funds face "use-it-or-lose-it" pressure, prompting a rise in club deals that spread risk while preserving deployment velocity. Despite valuation inflation in some pockets, disciplined managers leverage earn-out structures and contingent pricing to protect downside and preserve target returns.
Rising Allocations to Alternatives by Pension & Sovereign Investors
A Nuveen survey of 800 global institutions overseeing USD 19 trillion shows 66% plan to raise private equity allocations in the next five years. Sovereign wealth funds from the Gulf Cooperation Council and Asia are leading direct-deal syndicates, often writing USD 1-2 billion equity tickets to secure governance rights. These long-horizon investors perceive the asset class as a hedge against public-market volatility and inflation risk, enabling them to tolerate longer J-curves. Co-investment demand is reshaping economics, as funds negotiate lower carry on side-by-side tranches in exchange for speed of execution. The steady flow of large institutional money underpins fundraising even when macro conditions tighten, providing a durable base that smooths the capital-formation cycle.
Higher Interest-Rate Driven Financing Costs
The pivot from near-zero to normalized rates is lifting debt-service burdens and trimming leverage, forcing equity contributions to rise. MSCI data show held assets now carry higher leverage than realized deals, hinting at future valuation pressure. Senior lenders are tightening covenants, reintroducing maintenance tests absent for a decade, and pushing spreads up 150-200 basis points. To bridge the funding gap, sponsors draw on a USD 2.1 trillion private-credit market that prices flexibly but at premiums of 50-100 basis points over syndicated loans. Refinancing walls in 2026-2027 will test weaker capital structures, creating entry points for distressed and special-situations funds. Top-tier firms with permanent capital vehicles can weather the rate environment, but mid-tier sponsors may struggle to meet distribution expectations, constraining overall growth.
Other drivers and restraints analyzed in the detailed report include:
- Digital Transformation Demand for Operational Value Creation
- Retail-Investor Access via Semi-Liquid / 401(k) Structures
- Bid-Ask Valuation Gaps Suppressing Exits
For complete list of drivers and restraints, kindly check the Table Of Contents.
Segment Analysis
Buyout strategies captured 40.5% of the private equity market size in 2024 and remain the reference point for institutional allocations. Investors appreciate the visibility of value-creation levers, pricing, operations, and capital discipline, plus recognizable benchmarking indices. Activity is pronounced in Europe, where conglomerates spin off non-core subsidiaries and aging family businesses seek succession solutions. Within the United States, corporate carve-outs remain plentiful as public companies sharpen their focus on core assets, providing a pipeline of platform deals. Venture capital shows selective resilience in artificial intelligence, life-sciences tools, and clean-tech, while growth equity pursues capital-efficient SaaS models that resist macro swings.
Secondaries and fund-of-funds record a 9.34% CAGR, the fastest clip among fund types. Limited partners welcome early liquidity, and sponsors obtain fresh capital without conventional sales, smoothing internal-rate-of-return profiles. Niche players now underwrite preferred-equity bridges that offer partial liquidity and upside participation, broadening the toolset. As regulatory constraints tighten around transparency, specialized secondaries managers embed ESG due diligence modules, a feature that helps large LPs meet reporting mandates without reinventing workflows. Over the forecast horizon, the private equity market expects secondaries to institutionalize further, supporting a more continuous liquidity spectrum.
The Global Private Equity Market is Segmented by Fund Type (Buyout and Growth, Venture Capital, Mezzanine, and More), Sector (Technology, Healthcare, Real Estate, Financial Services, Industrials, Telecom, and More), Investments (Large Cap, Upper-Middle Market, and More), and Region (Europe, North America, South America, Asia-Pacific, and Middle East and Africa). The Market Forecasts are Provided in Terms of Value (USD).
Geography Analysis
North America held 53.2% of the private equity market in 2024, supported by deep capital markets, stable regulation, and sector breadth. US activity featured public-to-private deals such as Blackstone's Cvent acquisition and KKR's multifamily portfolio purchase. Energy-transition infrastructure, digital-infrastructure build-outs, and corporate carve-outs underpin deal pipelines. Canada's resource sector and Mexico's manufacturing ecosphere diversify exposure, with near-shoring trends elevating cross-border M&A. Liquidity remains dependable thanks to robust IPO channels, secondary sales to strategic buyers, and a thriving secondary-market ecosystem.
Europe demonstrated double-digit investment and exit growth in 2024, recovering after macro headwinds. The DACH region leads in industrial automation and climate-tech, while Nordic countries capitalize on digital services expertise and renewable energy dominance. Artificial-intelligence funding doubled, highlighting a sector pivot toward long-duration themes. The United Kingdom's upcoming PISCES exchange seeks to democratize access to the private equity market for retail investors, though full launch remains pending regulatory clearance. Southern Europe trails but benefits from tourism recovery and EU Green Deal subsidies that catalyze infrastructure deals. Together, these dynamics sustain Europe's relevance despite higher financing costs and geopolitical uncertainties.
Asia-Pacific is forecast to grow at an 8.95% CAGR, propelled by Japan's 183% surge in deal value that elevated it to the region's largest private equity market. Corporate-governance reforms and succession issues in listed conglomerates offer fresh buyout candidates. China tilts toward domestic healthcare and consumer plays as outbound restrictions persist, while policy support for green manufacturing boosts PE interest in battery supply chains. India sees robust deal flow across healthcare, fintech, and SaaS, leveraging demographic dividends and regulatory digitization initiatives. Southeast Asia's digital-economy boom, combined with public-private partnership projects in Indonesia and Vietnam, draws infrastructure funds. Australia and New Zealand provide resource and agriculture diversification, rounding out a region whose dynamism offsets North America's maturity.
- Bain Capital
- BC Partners
- Blackstone
- Brookfield Asset Management
- Carlyle Group
- Cinven
- Clayton Dubilier & Rice
- CVC Capital Partners
- EQT AB
- General Atlantic
- Hellman & Friedman
- Insight Partners
- KKR
- Neuberger Berman
- Oaktree Capital Management
- Partners Group
- Permira
- Silver Lake
- Thoma Bravo
- TPG Capital
- Vista Equity Partners
- Apollo Global Management
Additional Benefits:
- The market estimate (ME) sheet in Excel format
- 3 months of analyst support
TABLE OF CONTENTS
1 Introduction
- 1.1 Study Assumptions & Market Definition
- 1.2 Scope of the Study
2 Research Methodology
3 Executive Summary
4 Market Landscape
- 4.1 Market Overview
- 4.2 Market Drivers
- 4.2.1 Record dry-powder balances seeking deployment
- 4.2.2 Rising allocations to alternatives by pension & sovereign investors
- 4.2.3 Digital transformation demand for operational value-creation expertise
- 4.2.4 Retail-investor access via semi-liquid / 401(k) structures
- 4.2.5 Liquidity unlocked through continuation & secondary funds (under-the-radar)
- 4.2.6 Tokenisation of fund units enabling fractional ownership (under-the-radar)
- 4.3 Market Restraints
- 4.3.1 Higher interest-rate driven financing costs
- 4.3.2 Bid-ask valuation gaps suppressing exits
- 4.3.3 Stricter ESG & impact-reporting compliance burdens (under-the-radar)
- 4.3.4 AIFMD II & equivalent data-transparency mandates (under-the-radar)
- 4.4 Value / Supply-Chain (Deal Cycle) Analysis
- 4.5 Regulatory Landscape
- 4.6 Technological Outlook
- 4.7 Porter's Five Forces
- 4.7.1 Threat of New Entrants
- 4.7.2 Bargaining Power of Limited Partners
- 4.7.3 Bargaining Power of Investee Companies
- 4.7.4 Threat of Substitute Asset Classes
- 4.7.5 Intensity of Competitive Rivalry
5 Market Size & Growth Forecasts (Value, USD billions)
- 5.1 By Fund Type
- 5.1.1 Buyout & Growth
- 5.1.2 Venture Capital
- 5.1.3 Mezzanine & Distressed
- 5.1.4 Secondaries & Fund of Funds
- 5.2 By Sector
- 5.2.1 Technology (Software)
- 5.2.2 Healthcare
- 5.2.3 Real Estate and Services
- 5.2.4 Financial Services
- 5.2.5 Industrials
- 5.2.6 Consumer & Retail
- 5.2.7 Energy & Power
- 5.2.8 Media & Entertainment
- 5.2.9 Telecom
- 5.2.10 Others (Transportation, etc.)
- 5.3 By Investments
- 5.3.1 Large Cap
- 5.3.2 Upper Middle Market
- 5.3.3 Lower Middle Market
- 5.3.4 Small & SMID
- 5.4 By Geography
- 5.4.1 North America
- 5.4.1.1 Canada
- 5.4.1.2 United States
- 5.4.1.3 Mexico
- 5.4.2 South America
- 5.4.2.1 Brazil
- 5.4.2.2 Argentina
- 5.4.2.3 Rest of South America
- 5.4.3 Asia-Pacific
- 5.4.3.1 India
- 5.4.3.2 China
- 5.4.3.3 Japan
- 5.4.3.4 Australia
- 5.4.3.5 South Korea
- 5.4.3.6 South East Asia (Singapore, Malaysia, Thailand, Indonesia, Vietnam, and Philippines)
- 5.4.3.7 Rest of Asia-Pacific
- 5.4.4 Europe
- 5.4.4.1 United Kingdom
- 5.4.4.2 Germany
- 5.4.4.3 France
- 5.4.4.4 Spain
- 5.4.4.5 Italy
- 5.4.4.6 BENELUX (Belgium, Netherlands, and Luxembourg)
- 5.4.4.7 NORDICS (Denmark, Finland, Iceland, Norway, and Sweden)
- 5.4.4.8 Rest of Europe
- 5.4.5 Middle East And Africa
- 5.4.5.1 United Arab of Emirates
- 5.4.5.2 Saudi Arabia
- 5.4.5.3 South Africa
- 5.4.5.4 Nigeria
- 5.4.5.5 Rest of Middle East And Africa
- 5.4.1 North America
6 Competitive Landscape
- 6.1 Market Concentration
- 6.2 Strategic Moves
- 6.3 Market Share Analysis
- 6.4 Company Profiles (includes Global level Overview, Market level overview, Core Segments, Financials as available, Strategic Information, Market Rank/Share for key companies, Products & Services, and Recent Developments)
- 6.4.1 Bain Capital
- 6.4.2 BC Partners
- 6.4.3 Blackstone
- 6.4.4 Brookfield Asset Management
- 6.4.5 Carlyle Group
- 6.4.6 Cinven
- 6.4.7 Clayton Dubilier & Rice
- 6.4.8 CVC Capital Partners
- 6.4.9 EQT AB
- 6.4.10 General Atlantic
- 6.4.11 Hellman & Friedman
- 6.4.12 Insight Partners
- 6.4.13 KKR
- 6.4.14 Neuberger Berman
- 6.4.15 Oaktree Capital Management
- 6.4.16 Partners Group
- 6.4.17 Permira
- 6.4.18 Silver Lake
- 6.4.19 Thoma Bravo
- 6.4.20 TPG Capital
- 6.4.21 Vista Equity Partners
- 6.4.22 Apollo Global Management
7 Market Opportunities & Future Outlook
- 7.1 White-space & Unmet-need Assessment

