
PUBLISHER: Mordor Intelligence | PRODUCT CODE: 1844628

PUBLISHER: Mordor Intelligence | PRODUCT CODE: 1844628
Shunt Reactor - Market Share Analysis, Industry Trends & Statistics, Growth Forecasts (2025 - 2030)
The shunt reactor market size holds a value of USD 2.63 billion in 2025 and is forecast to climb to USD 3.59 billion by 2030, reflecting a 6.42% CAGR during 2025-2030.
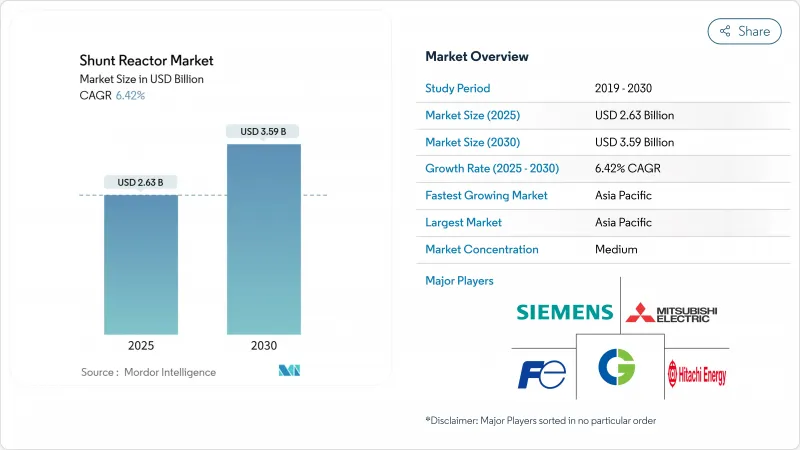
Accelerating renewable integration, the proliferation of high-voltage direct-current (HVDC) links, and tightening voltage-stability rules are the principal demand catalysts that anchor this trajectory. HVDC interconnections across Europe and China require sizeable inductive compensation at converter stations, while North America's inverter-dominated renewable fleets add a similar need for dynamic reactive-power control. Asia-Pacific remains the prime arena for grid-modernization projects, underpinned by China's ultra-high-voltage build-out and India's grid-code enforcement. Fixed reactor designs continue to dominate purchases, yet variable units and air-core dry designs are growing faster as utilities seek flexible and environmentally neutral solutions. Competitive intensity stays moderate because the complex engineering and qualification cycles favor experienced suppliers with global manufacturing footprints.
Global Shunt Reactor Market Trends and Insights
Expanding HVDC Interconnections Drive Market Acceleration
Large-scale HVDC corridors reshape the shunt reactor market by multiplying compensation points along converter stations and overhead routes. China's 800 kV Jinsha River-Hubei line illustrates this pattern by deploying multiple reactor banks to regulate steady-state and transient voltage on a 1,901 km stretch. Parallel investment across Europe under a EUR 584 billion grid program creates similar demand for inductive compensation at each cross-border converter node. The need intensifies as interconnected systems pursue energy security, because bidirectional flows amplify reactive-power swings during power-transfer fluctuations.
Renewable Generation Imbalance Accelerates Compensation Needs
Wind and solar fleets inject capacitive charging currents that lift line voltage during light-load periods, forcing operators to install inductive hardware for containment. In Texas and the Great Plains, wind additions already trigger dynamic compensation calls in day-ahead dispatch. Offshore wind cables deepen the imbalance because long subsea links possess high capacitive reactance, hence each string typically receives a dedicated shunt reactor cabinet onshore. The intermittent profile of renewables compels utilities to adopt variable designs that can modulate MVAr output in real time, thereby underscoring technology upgrades across the shunt reactor market.
Supply-Chain Constraints Limit Production Capacity
Non-grain-oriented electrical steel must satisfy narrow magnetic-loss windows, yet worldwide melting capacity remains concentrated in a few mills. Post-pandemic logistics snarls and power-equipment super-cycle demand strain availability, extending shunt-reactor delivery lead times and elevating material cost premiums.. Projects that rely on large-scale units above 400 kV bear the heaviest exposure because every tank requires significant tonnage of premium laminations.
Other drivers and restraints analyzed in the detailed report include:
- Grid-Code Mandates Enforce Voltage-Stability Standards
- Industrial Electrification Drives Infrastructure Demand
- STATCOM Technology Poses Substitution Threat
For complete list of drivers and restraints, kindly check the Table Of Contents.
Segment Analysis
Oil-immersed designs captured 67.7% of the shunt reactor market in 2024 and remain indispensable for voltages above 400 kV because mineral oil enhances insulation strength and dissipates heat efficiently. This segment safeguards its revenue base as long-span HVDC and UHVAC lines proliferate, reinforcing demand at the high-end of the voltage spectrum. Yet utilities with stringent environmental objectives pivot toward dry-type solutions that eliminate oil leakage risk and cut fire hazards.
Air-core dry technology posts a 6.8% CAGR, outpacing the broader shunt reactor market as lifecycle cost calculations favor maintenance-free operation. Environmental permitting processes in Europe and select North American states now score oil-free assets higher, stimulating pilot deployments in coastal wind-integration substations. Longer service intervals and compact footprints strengthen the business case in urban installations that face staffing and space constraints.
Fixed units retained 58.4% revenue in 2024, signifying their reliability for steady-state inductive compensation on long cables and overhead lines. Such tanks often link to a single operating point, yielding low complexity and favorable capex per MVAr, hence utilities still specify them for base-load compensation schemes within the shunt reactor market size.
Variable shunt reactors, advancing at 7.4% CAGR, integrate tap-changers that modulate inductive output across a continuous range. Grid operators adopt them to smooth voltage during renewable ramps, thereby curtailing breaker operations and capacitor bank switching events. Successful deployments on Slovenian and Croatian 400 kV corridors validate technical maturity, encouraging wider use in offshore wind export circuits where dynamic absorption prevents over-voltages during cable
The Shunt Reactor Market Report is Segmented by Type of Product (Oil-Immersed Reactor and Air Core Dry Reactor), Form Factor (Fixed Shunt Reactor, and More), Phase (Single-Phase Reactor and More), Rated Voltage (Less Than 200kV, and More), End-User (Transmission Utilities and More), and Geography. The Market Forecasts are Provided in Terms of Value (USD).
Geography Analysis
Asia-Pacific generated 41.8% of shunt reactor market revenue in 2024 and is forecast to advance at a 6.7% CAGR to 2030. China completed 42 UHV lines by late-2024, each embedding multiple 300 MVAr shunt banks to secure voltage along 1,000 km corridors. India's grid-modernization push aligns with a 500 GW non-fossil target by 2030, spurring purchases across 178,975 circuit km of EHV lines. Indonesia and Vietnam enrich regional growth as steel and petrochemical clusters electrify production, driving localized compensation requirements.
North America maintains mature but steady growth, propelled by aged equipment replacement and inverter-rich renewable additions. The United States confronts a transformer shortage that extends to allied reactors, with only 20% domestic supply coverage forcing utilities to place advance orders . Canada emphasizes remote renewable integration from hydro and wind hubs, necessitating long-distance 230-500 kV lines that incorporate inductive support to safeguard voltage stability against load rejection events.
Europe's market pivots on aggressive decarbonization and cross-border meshing of national grids. The European Commission earmarks EUR 584 billion for networks by 2030, with large slices devoted to 525 kV HVDC links that rely on site-specific compensation reactors. Offshore wind farms in the North and Baltic Seas feed via 66-kV array cables into long 220-320 kV export routes, each requiring inductive absorption onshore to offset capacitive charging. Environmental compliance influences buying patterns toward dry-type and variable designs, accelerating technology migration within the continent.
- Hitachi Energy Ltd.
- Siemens Energy AG
- Mitsubishi Electric Corporation
- GE Grid Solutions
- Hyosung Heavy Industries
- Fuji Electric Co., Ltd.
- CG Power and Industrial Solutions Ltd.
- Trench Group (Siemens)
- TBEA Co., Ltd.
- NR Electric Co., Ltd.
- Toshiba Energy Systems and Solutions Corp.
- SGB-SMIT Group
- Zaporozhtransformator PJSC
- Shandong Taikai Power Engineering Co., Ltd.
- Hyundai Electric and Energy Systems Co., Ltd.
- Bharat Heavy Electricals Ltd.
- Beijing Power Equipment Group
- Coil Innovation GmbH
Additional Benefits:
- The market estimate (ME) sheet in Excel format
- 3 months of analyst support
TABLE OF CONTENTS
1 INTRODUCTION
- 1.1 Study Assumptions and Market Definition
- 1.2 Scope of the Study
2 RESEARCH METHODOLOGY
3 EXECUTIVE SUMMARY
4 MARKET LANDSCAPE
- 4.1 Market Overview
- 4.2 Market Drivers
- 4.2.1 Expanding HVDC interconnection projects in Europe and China
- 4.2.2 Rapid addition of renewable generation capacity causing reactive power imbalance in North America
- 4.2.3 Grid-code mandates for voltage stability in India and MENA utilities
- 4.2.4 Refurbishment of aging sub-transmission networks (Less than 220 kV) in the United States and Canada
- 4.2.5 Industrial electrification push in SE-Asian steel and chemical clusters
- 4.2.6 Surge in offshore-wind export cables requiring More than 400 kV compensation reactors
- 4.3 Market Restraints
- 4.3.1 Supply-chain tightness for high-grade electrical steel laminations
- 4.3.2 Environmental-clearance delays for mega-corridors in Brazil
- 4.3.3 Capital-cost premium of variable shunt reactors below 220 kV
- 4.3.4 Substitution risk from STATCOM deployments in urban substations
- 4.4 Industry Ecosystem Analysis
- 4.5 Technological Outlook
- 4.6 Porter's Five Forces Analysis
- 4.6.1 Threat of New Entrants
- 4.6.2 Bargaining Power of Buyers
- 4.6.3 Bargaining Power of Suppliers
- 4.6.4 Threat of Substitute Products
- 4.6.5 Intensity of Competitive Rivalry
5 MARKET SIZE AND GROWTH FORECASTS (VALUES)
- 5.1 By Product Type
- 5.1.1 Oil-Immersed Shunt Reactor
- 5.1.2 Air-core Dry Shunt Reactor
- 5.2 By Form Factor
- 5.2.1 Fixed Shunt Reactor
- 5.2.2 Variable Shunt Reactor
- 5.3 By Phase
- 5.3.1 Single-Phase Reactor
- 5.3.2 Three-Phase Reactor
- 5.4 By Rated Voltage
- 5.4.1 Less than 200 kV
- 5.4.2 200-400 kV
- 5.4.3 Above 400 kV
- 5.5 By End-user
- 5.5.1 Transmission Utilities
- 5.5.2 Distribution Utilities
- 5.5.3 Industrial (Steel, Petrochemical, Cement, Data Centers)
- 5.5.4 Renewable Project Developers
- 5.6 By Geography
- 5.6.1 North America
- 5.6.1.1 United States
- 5.6.1.2 Canada
- 5.6.1.3 Mexico
- 5.6.2 Europe
- 5.6.2.1 Germany
- 5.6.2.2 United Kingdom
- 5.6.2.3 France
- 5.6.2.4 Nordics
- 5.6.2.5 Rest of Europe
- 5.6.3 South America
- 5.6.3.1 Brazil
- 5.6.3.2 Rest of South America
- 5.6.4 Asia-Pacific
- 5.6.4.1 China
- 5.6.4.2 Japan
- 5.6.4.3 India
- 5.6.4.4 South-East Asia
- 5.6.4.5 Rest of Asia-Pacific
- 5.6.5 Middle East and Africa
- 5.6.5.1 Middle East
- 5.6.5.1.1 Gulf Cooperation Council Countries
- 5.6.5.1.2 Turkey
- 5.6.5.1.3 Rest of Middle East
- 5.6.5.2 Africa
- 5.6.5.2.1 South Africa
- 5.6.5.2.2 Rest of Africa
- 5.6.1 North America
6 COMPETITIVE LANDSCAPE
- 6.1 Market Concentration
- 6.2 Strategic Moves
- 6.3 Market Share Analysis
- 6.4 Company Profiles (includes Global-level Overview, Market-level Overview, Core Segments, Financials as available, Strategic Information, Market Rank/Share, Products and Services, Recent Developments)
- 6.4.1 Hitachi Energy Ltd.
- 6.4.2 Siemens Energy AG
- 6.4.3 Mitsubishi Electric Corporation
- 6.4.4 GE Grid Solutions
- 6.4.5 Hyosung Heavy Industries
- 6.4.6 Fuji Electric Co., Ltd.
- 6.4.7 CG Power and Industrial Solutions Ltd.
- 6.4.8 Trench Group (Siemens)
- 6.4.9 TBEA Co., Ltd.
- 6.4.10 NR Electric Co., Ltd.
- 6.4.11 Toshiba Energy Systems and Solutions Corp.
- 6.4.12 SGB-SMIT Group
- 6.4.13 Zaporozhtransformator PJSC
- 6.4.14 Shandong Taikai Power Engineering Co., Ltd.
- 6.4.15 Hyundai Electric and Energy Systems Co., Ltd.
- 6.4.16 Bharat Heavy Electricals Ltd.
- 6.4.17 Beijing Power Equipment Group
- 6.4.18 Coil Innovation GmbH
7 MARKET OPPORTUNITIES AND FUTURE OUTLOOK
- 7.1 White-space and Unmet-need Assessment

