
PUBLISHER: Mordor Intelligence | PRODUCT CODE: 1850098

PUBLISHER: Mordor Intelligence | PRODUCT CODE: 1850098
Smart Meters (AMI) - Market Share Analysis, Industry Trends & Statistics, Growth Forecasts (2025 - 2030)
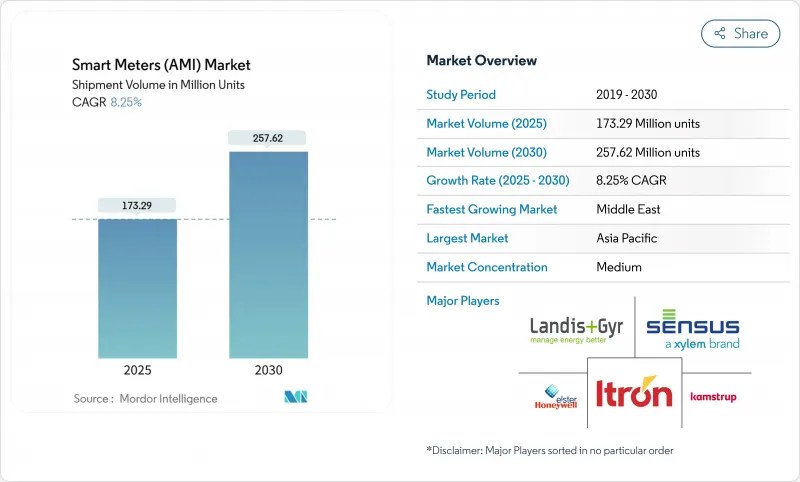
The smart meters (AMI) market size in terms of shipment volume is expected to grow from 173.29 million units in 2025 to 257.62 million units by 2030, advancing at an 8.25% CAGR.
Government-mandated deployment schedules, rising grid-resilience priorities, and edge-computing advances jointly sustain the expansion of the smart meters AMI market. Utilities accelerate capital spending, and regulators increasingly define smart metering as critical infrastructure, reducing the time between approval and rollout. At the same time, edge-AI functionality embedded in next-generation devices enables real-time analytics that improve outage response, demand forecasting, and distributed energy resource integration. Intensifying cybersecurity investments, global chip-supply diversification, and vendor efforts to bundle hardware with analytics software further propel market momentum.
Global Smart Meters (AMI) Market Trends and Insights
Government Mandates and Regulatory Push
Mandatory deployment rules transform meters from optional upgrades into compulsory grid assets. Australia's National Electricity Market now requires 100% smart meter coverage by 2030, eliminating opt-out provisions after June 2025 and ensuring universal visibility across low-voltage networks. Similar mandates surface across several U.S. states, shifting cost-benefit debates toward implementation logistics and creating predictable demand for vendors.
Rising Investments in Grid Modernisation
Utility capital programs reach record levels, underscored by FirstEnergy's USD 26 billion Energize365 plan running through 2028, which bundles smart meters with distribution automation, cybersecurity, and renewable integration infrastructure. These multiphase projects compress rollouts into five-year windows, supporting sustained equipment and software revenues for the smart meters AMI market.
High Upfront Cost and Long Payback
Smaller utilities face capital hurdles: Public Service Company of New Mexico budgets USD 188 million for 500,000 meters, translating to USD 375 per endpoint including communications and installation. Where tariff recovery is uncertain, boards delay projects or adopt phased rollouts.
Other drivers and restraints analyzed in the detailed report include:
- Utility Efficiency and Loss-Reduction Needs
- Smart-City and IoT Infrastructure Expansion
- Cyber-Security and Data-Privacy Risks
For complete list of drivers and restraints, kindly check the Table Of Contents.
Segment Analysis
Smart Electricity Meters hold 53.7% of the smart meters AMI market share in 2024, underpinning large-scale demand response programs and distributed generation integration. The segment remains central to most regulatory mandates, ensuring continued volume dominance. Smart Gas Meters follow, supported by leak-detection and safety imperatives in dense urban areas. Smart Water Meters register the fastest 8.7% CAGR because utilities combat non-revenue water losses that in some regions surpass 30%. The smart meters AMI market size for water applications is projected to expand steadily as drought-prone districts adopt continuous monitoring to enforce usage caps.
Water utilities see immediate revenue recovery when analytics expose inaccuracies; an Atlanta pilot saved over USD 1 million using AI-based meter diagnostics, showcasing how edge analytics foster rapid return on investment for the smart meters AMI industry. Multi-utility deployments leveraging a single communications backbone further lift project economics, allowing electricity, gas, and water meters to share gateways and data platforms.
RF-Mesh retains 55.9% adoption in 2024, valued for self-healing topology and high packet redundancy, particularly in dense metropolises. Yet NB-IoT and other cellular approaches are forecast to grow at 9.2% annually as nationwide 5G builds unlock low-latency, high-bandwidth channels for real-time power-quality data. The smart meters AMI market benefits from telecom operators' spectrum holdings and backhaul infrastructure, enabling utilities to avoid expensive private network rollouts.
Cellular solutions also support remote firmware updates and secure over-the-air key management, elements crucial to grid-edge cybersecurity. As IoT device density climbs, advanced spectrum management and network slicing optimise traffic prioritisation, preventing congestion and safeguarding metering performance. These capabilities encourage utilities to shift upcoming tenders towards hybrid or fully cellular architectures in the smart meters AMI industry.
Smart Meter Market is Segmented by Product Type (Smart Electricity Meters, Smart Gas Meters, and More), Communication Technology (RF-Mesh Cellular (2G/3G/4G/5G/NB-IoT), Others), Component (Hardware, Software, Services), End User (Residential, Commercial, Industrial and Utilities), and by Geography. The Market Forecasts are Provided in Terms of Volume (Units).
Geography Analysis
Asia-Pacific contributes 25.5% of global deployments in 2024, anchored by China's state-directed rollouts, India's national smart-grid roadmap, and Japan's post-Fukushima reforms. Mainland China alone has surpassed 700 million cumulative smart meter installations, benefiting from central procurement mechanisms that reduce unit costs and guarantee widespread interoperability. India's programme emphasises loss reduction and pre-payment functionality, bringing immediate cash-flow benefits to distribution companies.
The Middle East and Africa present the highest regional CAGR at 10.6% through 2030. Gulf Cooperation Council utilities leverage oil revenues to finance smart-city projects, bundling AMI with district-cooling and rooftop solar schemes, while South African and Kenyan regulators use smart metering to curb theft and widen prepaid adoption. Vendor financing and public-private partnership models gain traction where sovereign budgets are tight.
- Landis+Gyr Group AG
- Itron Inc.
- Sensus USA Inc. (Xylem Inc.)
- Honeywell (Elster Group)
- Kamstrup A/S
- Siemens AG
- Schneider Electric SE
- Huawei Technologies Co. Ltd.
- General Electric Co.
- Aclara Technologies LLC (Hubbell)
- EDMI Limited (Osaki Electric)
- Apator SA
- Arad Group
- Badger Meter Inc.
- Diehl Metering GmbH
- Hexing Electrical Co. Ltd.
- Holley Technology Ltd.
- Jiangsu Linyang Energy Co.
- Wasion Holdings Ltd.
- Zenner International GmbH
- Neptune Technology Group (Roper)
- Baylan Water Meters
- ZIV Automation
- Pietro Fiorentini SpA
- ADD GRUP
- Yazaki Corporation
Additional Benefits:
- The market estimate (ME) sheet in Excel format
- 3 months of analyst support
TABLE OF CONTENTS
1 INTRODUCTION
- 1.1 Study Assumptions and Market Definition
- 1.2 Scope of the Study
2 RESEARCH METHODOLOGY
3 EXECUTIVE SUMMARY
4 MARKET LANDSCAPE
- 4.1 Market Overview
- 4.2 Market Drivers
- 4.2.1 Government mandates and regulatory push
- 4.2.2 Rising investments in grid modernisation
- 4.2.3 Utility efficiency and loss-reduction needs
- 4.2.4 Smart-city and IoT infrastructure expansion
- 4.2.5 Carbon-accounting and ESG compliance needs
- 4.2.6 Edge-AI analytics enabling new services
- 4.3 Market Restraints
- 4.3.1 High upfront cost and long payback
- 4.3.2 Cyber-security and data-privacy risks
- 4.3.3 Legacy-grid integration complexity
- 4.3.4 Chip-supply volatility delays roll-outs
- 4.4 Supply-Chain Analysis
- 4.5 Regulatory Landscape
- 4.6 Technological Outlook
- 4.7 Porter's Five Forces
- 4.7.1 Bargaining Power of Suppliers
- 4.7.2 Bargaining Power of Buyers
- 4.7.3 Threat of New Entrants
- 4.7.4 Threat of Substitute Products
- 4.7.5 Degree of Competition
- 4.8 Assesment of Macroeconomic Factors on the market
5 MARKET SIZE AND GROWTH FORECASTS (VOLUME)
- 5.1 By Product Type
- 5.1.1 Smart Electricity Meters
- 5.1.2 Smart Gas Meters
- 5.1.3 Smart Water Meters
- 5.2 By Communication Technology
- 5.2.1 RF-Mesh
- 5.2.2 Cellular (2G/3G/4G/5G/NB-IoT)
- 5.2.3 Others
- 5.3 By Component
- 5.3.1 Hardware
- 5.3.2 Software
- 5.3.3 Services
- 5.4 By End-User
- 5.4.1 Residential
- 5.4.2 Commercial
- 5.4.3 Industrial and Utilities
- 5.5 By Region
- 5.5.1 North America
- 5.5.1.1 United States
- 5.5.1.2 Canada
- 5.5.1.3 Mexico
- 5.5.2 South America
- 5.5.2.1 Brazil
- 5.5.2.2 Argentina
- 5.5.2.3 Rest of South America
- 5.5.3 Europe
- 5.5.3.1 Germany
- 5.5.3.2 United Kingdom
- 5.5.3.3 France
- 5.5.3.4 Italy
- 5.5.3.5 Spain
- 5.5.3.6 Russia
- 5.5.3.7 Rest of Europe
- 5.5.4 Asia-Pacific
- 5.5.4.1 China
- 5.5.4.2 Japan
- 5.5.4.3 India
- 5.5.4.4 South Korea
- 5.5.4.5 Australia and New Zealand
- 5.5.4.6 Southeast Asia
- 5.5.4.7 Rest of Asia-Pacific
- 5.5.5 Middle East and Africa
- 5.5.5.1 Middle East
- 5.5.5.1.1 Saudi Arabia
- 5.5.5.1.2 United Arab Emirates
- 5.5.5.1.3 Turkey
- 5.5.5.1.4 Rest of Middle East
- 5.5.5.2 Africa
- 5.5.5.2.1 South Africa
- 5.5.5.2.2 Nigeria
- 5.5.5.2.3 Egypt
- 5.5.5.2.4 Rest of Africa
- 5.5.1 North America
6 COMPETITIVE LANDSCAPE
- 6.1 Market Concentration
- 6.2 Strategic Moves
- 6.3 Market Share Analysis
- 6.4 Company Profiles (includes Global level Overview, Market level overview, Core Segments, Financials as available, Strategic Information, Market Rank/Share for key companies, Products and Services, and Recent Developments)
- 6.4.1 Landis+Gyr Group AG
- 6.4.2 Itron Inc.
- 6.4.3 Sensus USA Inc. (Xylem Inc.)
- 6.4.4 Honeywell (Elster Group)
- 6.4.5 Kamstrup A/S
- 6.4.6 Siemens AG
- 6.4.7 Schneider Electric SE
- 6.4.8 Huawei Technologies Co. Ltd.
- 6.4.9 General Electric Co.
- 6.4.10 Aclara Technologies LLC (Hubbell)
- 6.4.11 EDMI Limited (Osaki Electric)
- 6.4.12 Apator SA
- 6.4.13 Arad Group
- 6.4.14 Badger Meter Inc.
- 6.4.15 Diehl Metering GmbH
- 6.4.16 Hexing Electrical Co. Ltd.
- 6.4.17 Holley Technology Ltd.
- 6.4.18 Jiangsu Linyang Energy Co.
- 6.4.19 Wasion Holdings Ltd.
- 6.4.20 Zenner International GmbH
- 6.4.21 Neptune Technology Group (Roper)
- 6.4.22 Baylan Water Meters
- 6.4.23 ZIV Automation
- 6.4.24 Pietro Fiorentini SpA
- 6.4.25 ADD GRUP
- 6.4.26 Yazaki Corporation
- 6.5 Market Ranking Analysis
- 6.5.1 Smart Electricity Meter Market
- 6.5.2 Smart Gas Meter Market
- 6.5.3 Smart Water Meter Market
7 MARKET OPPORTUNITIES AND FUTURE OUTLOOK
- 7.1 White-space and Unmet-Need Assessment

