
PUBLISHER: Mordor Intelligence | PRODUCT CODE: 1905996

PUBLISHER: Mordor Intelligence | PRODUCT CODE: 1905996
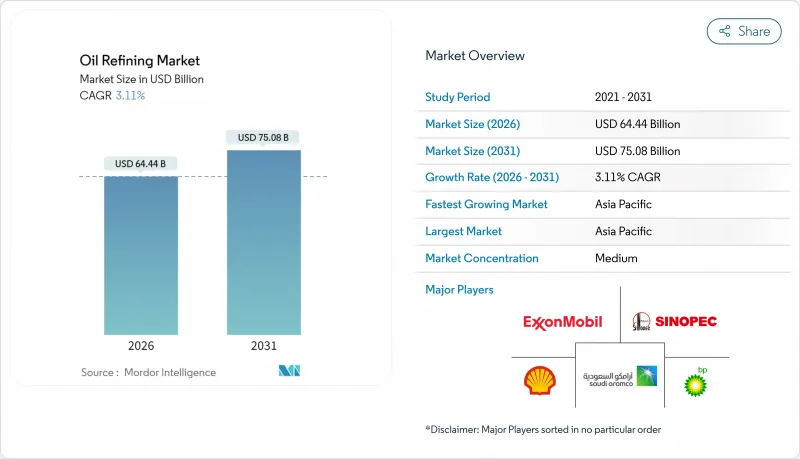
Oil Refining - Market Share Analysis, Industry Trends & Statistics, Growth Forecasts (2026 - 2031)
The Oil Refining Market was valued at USD 62.5 billion in 2025 and estimated to grow from USD 64.44 billion in 2026 to reach USD 75.08 billion by 2031, at a CAGR of 3.11% during the forecast period (2026-2031).
This forward trajectory stems from refiners' accelerated push into petrochemical integration, large-scale desulfurization retrofits, and renewable diesel platforms that help shield margins from soft gasoline demand. Operators that combine conversion depth, digital optimization, and diversified fuel slates continue to outperform, while plants locked into single-fuel economics or lacking feedstock flexibility are closing or converting to specialty uses. Refinery throughput growth remains strongest in the Asia-Pacific, the Middle East, and select African markets, where governments support downstream self-sufficiency and export ambitions. Simultaneously, OECD rationalization and ESG-linked capital scarcity limit green-field build in developed regions, intensifying the global contest for high-quality barrels and resilient cracks.
Global Oil Refining Market Trends and Insights
Petro-chemical feed-stock push in Asia bolstering conversion upgrades
Asia's refiners integrate catalytic crackers and polypropylene lines to move up the value chain. CNOOC's Ningbo upgrade added 450,000 tpy polypropylene capacity and lifted crude runs by 50%, giving the complex access to robust domestic chemical demand. Similar investments in India aim to target 35-40 million tonnes of new capacity by 2030, with naphtha being directed to aromatic and olefin chains. Integration protects margins from erosion driven by electric vehicles, while capturing higher petrochemical spreads that underpin long-term earnings resilience across the oil refining market.
Low-sulfur marine fuels post-IMO 2020 triggering desulfurization retrofits
The sulfur cap continues to reshape fuel quality expectations. ExxonMobil's Fawley investment includes a hydrotreater that produces 570 million gallons of low-sulfur diesel annually. Inland refiners also retrofit desulfurizers to supply premium bunker fuel, expanding geographic supply and improving arbitrage options. Sustained capital inflows toward compliance upgrades reinforce demand for hydrogen and catalyst systems, sustaining throughput flexibility and supporting the oil refining market.
OECD refinery rationalisation under net-zero targets
Europe and North America are closing or repurposing older plants as firms align with climate policies. TotalEnergies is converting Grandpuits into a zero-crude platform producing sustainable aviation fuel and biopolymers. Shell will end crude runs at Wesseling by 2025, shifting to base oils. These actions tighten regional supply, elevate utilization at surviving sites, and reshape product import patterns, yet cap capacity growth within the oil refining market.
Other drivers and restraints analyzed in the detailed report include:
- Middle-East NOCs' forward integration capturing downstream margins
- U.S. light-tight oil boom driving condensate splitter investments
- Rising ESG-driven capital scarcity for green-field plants
For complete list of drivers and restraints, kindly check the Table Of Contents.
Segment Analysis
Middle distillates retained a 37.12% oil refining market share in 2025, as jet fuel and diesel recovered alongside global travel and emerging-market freight. Light distillates continue to benefit from rising vehicle ownership in developing economies, yet face structural declines in mature regions. Heavy fuel oil struggles with stricter marine and power regulations, prompting investments in cokers and hydrocrackers to upgrade residues. The petrochemical feedstock category grows at the fastest rate, with a 3.85% CAGR, as integrated operators channel naphtha and LPG into high-margin polymer chains. The chemicals pivot enhances margin stability and supports a broader revenue base within the oil refining market.
Greater integration increases unit complexity, enhancing crude flexibility and enabling the selection of a diverse slate. CNOOC's polypropylene addition in Ningbo and Shell's Huizhou expansion, scheduled for 2028, highlight the trend toward operations centered on chemicals. Such projects expand the oil refining market size for high-conversion assets and shield earnings from gasoline displacement by electric vehicles.
The Oil Refining Market Report is Segmented by Product Slate (Light Distillates, Middle Distillates, Fuel Oil and Residuals, and Petro-Chemical Feed-Stocks), Ownership (National Oil Companies, Integrated Oil Companies, and Independent/Merchant Refiners), and Geography (North America, Europe, Asia-Pacific, South America, and Middle East and Africa). The Market Size and Forecasts are Provided in Terms of Revenue (USD).
Geography Analysis
Asia-Pacific's refining complex expansion underpins its leadership. CNOOC's USD 2.74 billion Ningbo upgrade lifted crude runs to 240,000 bpd, adding polypropylene units to meet domestic plastics demand. India's planned capacity builds worth INR 1.9-2.2 lakh crore support sustained supply as consumption expands at 4% CAGR. Southeast Asia is seeing new projects in Vietnam and Indonesia aimed at reducing product import dependence, while Japan and South Korea are focusing on high-efficiency operations and technology exports. The region's integrated models and government backing continue to enlarge the oil refining market.
North America remains a pivotal exporter. Shale-driven light crude availability reduces feedstock costs for Gulf Coast refineries. Phillips 66's Sweeny upgrades allow flexible runs that favor gasoline and chemical feedstock production. Valero channels USD 5.4 billion into low-carbon projects, including renewable diesel, to balance emissions objectives with margin capture. Canada and Mexico vie to modernize their assets amid policy shifts, yet the U.S. maintains a structural advantage in the oil refining market through its abundant feedstocks and deepwater logistics networks.
Europe experiences the fastest structural change. TotalEnergies converts Grandpuits to a renewable platform, while Shell repurposes Wesseling, removing conventional capacity yet adding sustainable aviation and base-oil output. Carbon pricing increases operating costs for heavy-fuel streams, incentivizing the conversion of units and the integration of hydrogen. Supply tightness from closures increases imports from the Middle East and the United States, elevating trans-Atlantic trade and reinforcing competitiveness gaps among surviving plants within the oil refining market.
- Exxon Mobil Corporation
- Sinopec Corp.
- Shell plc
- Saudi Aramco
- BP plc
- Chevron Corporation
- Valero Energy Corp.
- Marathon Petroleum Corp.
- Phillips 66
- Indian Oil Corporation Ltd.
- Rosneft PJSC
- CNPC
- TotalEnergies SE
- PKN Orlen SA
- Petrobras SA
- ENOC
- Reliance Industries Ltd.
- Petron Corp.
- PETRONAS
- Bharat Petroleum Corporation Limited
Additional Benefits:
- The market estimate (ME) sheet in Excel format
- 3 months of analyst support
TABLE OF CONTENTS
1 Introduction
- 1.1 Study Assumptions & Market Definition
- 1.2 Scope of the Study
2 Research Methodology
3 Executive Summary
4 Market Landscape
- 4.1 Market Overview
- 4.2 Market Drivers
- 4.2.1 Petro-chemical feed-stock push in Asia bolstering conversion upgrades
- 4.2.2 Low-sulfur marine fuels post-IMO 2020 triggering desulfurization retrofit wave
- 4.2.3 Middle-East NOCs' forward integration capturing downstream margins
- 4.2.4 U.S. light-tight oil boom driving condensate-splitter investments
- 4.2.5 Discounted Russian Urals stimulating European complex refinery margins
- 4.2.6 Renewable diesel co-processing incentives in OECD raising hydro-treating spend
- 4.3 Market Restraints
- 4.3.1 OECD refinery rationalization under net-zero targets
- 4.3.2 Rising ESG-driven capital scarcity for green-field plants
- 4.3.3 Volatile crack?spreads eroding ROCE for merchant refiners
- 4.3.4 Carbon-pricing schemes compressing heavy-fuel margins
- 4.4 Supply-Chain Analysis
- 4.5 Technological Outlook
- 4.6 Regulatory Outlook
- 4.7 Porter's Five Forces
- 4.7.1 Bargaining Power of Suppliers
- 4.7.2 Bargaining Power of Buyers
- 4.7.3 Threat of New Entrants
- 4.7.4 Threat of Substitutes
- 4.7.5 Competitive Rivalry
5 Market Size & Growth Forecasts
- 5.1 By Product Slate
- 5.1.1 Light Distillates (Gasoline, Naphtha)
- 5.1.2 Middle Distillates (Diesel/Gasoil, Jet/Kero)
- 5.1.3 Fuel Oil and Residuals
- 5.1.4 Petro-chemical Feed-stocks (Propylene, Aromatics)
- 5.2 By Ownership
- 5.2.1 National Oil Companies (NOCs)
- 5.2.2 Integrated Oil Companies (IOCs)
- 5.2.3 Independent/Merchant Refiners
- 5.3 By Geography
- 5.3.1 North America
- 5.3.1.1 United States
- 5.3.1.2 Canada
- 5.3.1.3 Mexico
- 5.3.2 Europe
- 5.3.2.1 United Kingdom
- 5.3.2.2 Germany
- 5.3.2.3 France
- 5.3.2.4 Spain
- 5.3.2.5 Nordic Countries
- 5.3.2.6 Russia
- 5.3.2.7 Rest of Europe
- 5.3.3 Asia-Pacific
- 5.3.3.1 China
- 5.3.3.2 India
- 5.3.3.3 Japan
- 5.3.3.4 South Korea
- 5.3.3.5 Malaysia
- 5.3.3.6 Thailand
- 5.3.3.7 Indonesia
- 5.3.3.8 Vietnam
- 5.3.3.9 Australia
- 5.3.3.10 Rest of Asia-Pacific
- 5.3.4 South America
- 5.3.4.1 Brazil
- 5.3.4.2 Argentina
- 5.3.4.3 Colombia
- 5.3.4.4 Rest of South America
- 5.3.5 Middle East and Africa
- 5.3.5.1 United Arab Emirates
- 5.3.5.2 Saudi Arabia
- 5.3.5.3 South Africa
- 5.3.5.4 Egypt
- 5.3.5.5 Rest of Middle East and Africa
- 5.3.1 North America
6 Competitive Landscape
- 6.1 Market Concentration
- 6.2 Strategic Moves (M&A, Partnerships, PPAs)
- 6.3 Market Share Analysis (Market Rank/Share for key companies)
- 6.4 Company Profiles (includes Global level Overview, Market level overview, Core Segments, Financials as available, Strategic Information, Products & Services, and Recent Developments)
- 6.4.1 Exxon Mobil Corporation
- 6.4.2 Sinopec Corp.
- 6.4.3 Shell plc
- 6.4.4 Saudi Aramco
- 6.4.5 BP plc
- 6.4.6 Chevron Corporation
- 6.4.7 Valero Energy Corp.
- 6.4.8 Marathon Petroleum Corp.
- 6.4.9 Phillips 66
- 6.4.10 Indian Oil Corporation Ltd.
- 6.4.11 Rosneft PJSC
- 6.4.12 CNPC
- 6.4.13 TotalEnergies SE
- 6.4.14 PKN Orlen SA
- 6.4.15 Petrobras SA
- 6.4.16 ENOC
- 6.4.17 Reliance Industries Ltd.
- 6.4.18 Petron Corp.
- 6.4.19 PETRONAS
- 6.4.20 Bharat Petroleum Corporation Limited
7 Market Opportunities & Future Outlook
- 7.1 White-space & Unmet-Need Assessment

