
PUBLISHER: Mordor Intelligence | PRODUCT CODE: 1906075

PUBLISHER: Mordor Intelligence | PRODUCT CODE: 1906075
Distribution Transformer - Market Share Analysis, Industry Trends & Statistics, Growth Forecasts (2026 - 2031)
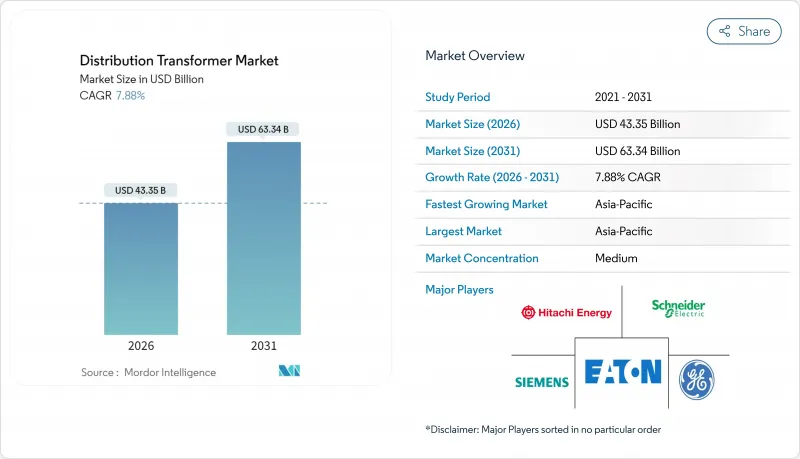
Distribution Transformer Market size in 2026 is estimated at USD 43.35 billion, growing from 2025 value of USD 40.18 billion with 2031 projections showing USD 63.34 billion, growing at 7.88% CAGR over 2026-2031.
Persistent supply shortages, grid modernization mandates, and new load pockets from data centers and e-mobility continue to widen the demand-supply gap, even as manufacturers add record capacity. Small units, up to 10 MVA, remain the volume backbone; yet, medium-rated equipment is expanding fastest as renewable-energy plants and urban substations require larger step-up ratios. Commodity inflation lifted finished-equipment prices by 60-80% between 2020 and 2025, but utilities still accelerate fleet replacements because half of all installed distribution transformers are approaching the end of their life. Regional policy incentives and domestic-content rules further reinforce local manufacturing projects, pushing a multi-billion-dollar investment wave through 2030.
Global Distribution Transformer Market Trends and Insights
Accelerated Grid-Modernisation and Replacement of Ageing Assets
More than half of the installed distribution transformers in developed economies were commissioned before 1995, and utilities now face simultaneous end-of-life curves and higher load factors. The National Renewable Energy Laboratory projects that US distribution transformer capacity must scale 160-260% by 2050 relative to 2021 to sustain electrification targets.Updated US efficiency standards entering force in 2029 are compelling purchasers to specify low-loss cores and digital sensors, raising unit prices but reducing lifetime losses. Storm-hardening initiatives in states such as Florida and California are accelerating the shift from overhead to pad-mounted assets with tamper-proof housings. Europe follows a similar trajectory as operators retrofit networks to accommodate low-emission zones that prohibit overhead lines. Demand for digitally enabled transformers that stream real-time vibration, moisture, and temperature data is surging because legacy fleets lack self-diagnostic capability.
Rapid Renewable-Energy Grid Interconnection Needs
Variable solar and wind resources have intensified bidirectional power flows, stressing distribution equipment designed for one-way electricity delivery. Europe's 45% renewable energy share goal for 2030 requires thousands of transformer upgrades to manage voltage flicker and reverse energy exports. Asia-Pacific utilities report similar pressures as rooftop PV penetrations exceed 20% in select provinces. <500 kVA transformers are increasingly sited at agricultural solar-plus-storage projects, driving the segment's 9.6% CAGR. Product specifications now include extended overload tolerance and wider tap-changer ranges to minimize intermittent issues. Specialized windings made from higher-silicon steel mitigate harmonic distortion emanating from inverter-based resources, thereby safeguarding power quality for sensitive household electronics.
Raw-Material Price Volatility (Copper, GO Steel)
Spot copper prices exceeded USD 10,600/t in 2024, and high-permeability electrical steel remains supply-constrained due to the limited number of mills that can process silicon grades of 3.2% or higher. Finished transformer prices jumped 60-80% compared to 2020 as manufacturers passed through their costs.OEMs hedge exposure via index-linked contracts and diversify to amorphous or nano-crystalline cores, which cut no-load losses up to 60% but raise fabrication complexity. Supply-chain resilience strategies now feature regional steel slitting centers and copper redraw lines to localize inputs.
Other drivers and restraints analyzed in the detailed report include:
- Government Electrification & Rural Energy-Access Programmes
- Surge in Data-Centre & EV-Charging Load Pockets
- Long Lead Times & Skilled-Labour Shortages
For complete list of drivers and restraints, kindly check the Table Of Contents.
Segment Analysis
Small transformers up to 10 MVA captured 58.02% of the distribution transformer market revenue in 2025, supplying industrial feeders, commercial complexes, and rural utilities. Standardized footprints allow high-volume production, ensuring cost competitiveness. Medium-rated equipment from 10 to 100 MVA is scaling at an 8.45% CAGR as renewable plant interconnections proliferate and urban substations upgrade their capacity. The distribution transformer market size for medium ratings is projected to expand steadily through 2031, reflecting government investment in solar and wind energy pipelines. Large units above 100 MVA remain a niche but critical market; their custom engineering and high material content make them particularly vulnerable to fluctuations in steel and copper prices. Digital twins and online partial-discharge monitoring are now standard across all ratings, advancing asset-health analytics and extending service life.
Oil-immersed designs continue to lead with a 64.21% market share due to their superior kVA-per-dollar metrics and overload capability. However, air-cooled dry-type designs will post the fastest 8.76% CAGR as fire-safety codes tighten in densely populated areas. Utilities retrofit indoor vaults with cast-resin coils to eliminate oil-spill risk, even at the expense of 1-2 percentage-point loss increases. Mineral-oil tanks are evolving toward natural or synthetic esters, cutting fire risk and enabling environmentally sensitive siting. Field trials confirm that ester-fluid retrofill can extend fleet life by 15-20 years without costly rewinds. Hybrid cooling, which combines forced-air top blowers with liquid jacket channels, is employed in high-density data center units where heat flux peaks.
The Distribution Transformer Market is Segmented by Power Rating (Large, Medium, and Small), Cooling Type (Air-Cooled and Oil-Cooled), Phase (Single-Phase and Three-Phase), End-User (Power Utilities, Industrial, Commercial, and Residential), and Geography (North America, Europe, Asia-Pacific, South America, and Middle East and Africa). The Market Sizes and Forecasts are Provided in Terms of Value (USD).
Geography Analysis
The Asia-Pacific region accounted for 41.55% of the distribution transformer market revenue in 2025 and is expected to sustain an 8.28% CAGR through 2031, driven by China's USD 400 billion grid optimization initiative and India's rural electrification efforts. Chinese manufacturers enjoy scale economies and cost-competitive domestic steel, giving them an edge in mineral-oil units, whereas Japanese and Korean vendors lead in ester-fluid and sensor-rich variants. Southeast Asian nations allocate development loans toward micro-grids and small hydro plants, enlarging the sub-500 kVA addressable base.
North America ranks second, buoyed by federal incentives for domestic transformer production and data-centre power demand surpassing 20 GW installed in 2024. Supply constraints prompted Hitachi Energy to erect a plant in Reynosa, Mexico, and expand its output in South Boston, Virginia, ensuring regional content for US projects. The US Department of Energy's new energy-efficiency rules will shift the share toward grain-oriented steel grades M3 and better, raising average selling prices but cutting lifetime losses.
Europe faces overlapping pressures, including ageing fleet replacement, 2030 renewable targets, and safety codes that favour ester-based fluids. Germany's incentive for low-noise transformers (<40 dB) stokes demand for step-lap cores and vibration-damping clamps. While high labour costs hamper local manufacturing, strategic clusters in Spain and Poland secure base-load orders. Eastern Europe's grid interconnection with Nordic hydro resources also triggers cross-border standard harmonisation.
The Middle East and Africa record mid-single-digit growth, where desalination plants, mining, and urbanisation require ruggedised oil-immersed models with high ambient derating. Saudi Arabia's NEOM megacity specifies smart pad-mounts with fibre-backhaul diagnostics. Latin American grids, particularly in Chile's Atacama solar hub and Brazil's wind corridor, require high-altitude and high-temperature derating curves, which are spurring the adoption of silicone oil and synthetic ester variants.
- Hitachi Energy Ltd.
- Siemens Energy AG
- Schneider Electric SE
- Eaton Corporation plc
- Mitsubishi Electric Corp.
- CG Power & Industrial Solutions Ltd.
- Bharat Heavy Electricals Ltd.
- SPX Transformer Solutions Inc.
- Wilson Transformer Co.
- Prolec GE
- Howard Industries Inc.
- Toshiba Energy Systems & Solutions
- Hyundai Electric & Energy Systems
- TBEA Co. Ltd.
- SGB-SMIT Group
- ABB Ltd. (Smart Transformers)
- Arteche Group
- WEIDMANN Electrical Technology
- Trench Group (Siemens)
Additional Benefits:
- The market estimate (ME) sheet in Excel format
- 3 months of analyst support
TABLE OF CONTENTS
1 Introduction
- 1.1 Study Assumptions & Market Definition
- 1.2 Scope of the Study
2 Research Methodology
3 Executive Summary
4 Market Landscape
- 4.1 Market Overview
- 4.2 Market Drivers
- 4.2.1 Accelerated grid-modernisation and replacement of ageing assets
- 4.2.2 Rapid renewable-energy grid interconnection needs
- 4.2.3 Government electrification & rural energy-access programmes
- 4.2.4 Surge in data-centre & EV-charging load pockets
- 4.2.5 Price-spike driven ROI boost for new OEM capacity
- 4.2.6 EU Tier-3 eco-design shift to ester fluids
- 4.3 Market Restraints
- 4.3.1 Raw-material price volatility (copper, GO steel)
- 4.3.2 Long lead-times & skilled-labour shortages
- 4.3.3 Rising insurance premiums for fire-risk designs
- 4.3.4 Emerging solid-state transformer substitution threat
- 4.4 Supply-Chain Analysis
- 4.5 Regulatory Landscape
- 4.6 Technological Outlook
- 4.7 Porters Five Forces
- 4.7.1 Bargaining Power of Suppliers
- 4.7.2 Bargaining Power of Consumers
- 4.7.3 Threat of New Entrants
- 4.7.4 Threat of Substitutes
- 4.7.5 Intensity of Rivalry
5 Market Size & Growth Forecasts
- 5.1 By Power Rating
- 5.1.1 Large (Above 100 MVA)
- 5.1.2 Medium (10 to 100 MVA)
- 5.1.3 Small (Up to 10 MVA)
- 5.2 By Cooling Type
- 5.2.1 Air-cooled
- 5.2.2 Oil-cooled
- 5.3 By Phase
- 5.3.1 Single-Phase
- 5.3.2 Three-Phase
- 5.4 By End-User
- 5.4.1 Power Utilities (includes, Renewables, Non-renewables, and T&D)
- 5.4.2 Industrial
- 5.4.3 Commercial
- 5.4.4 Residential
- 5.5 By Geography
- 5.5.1 North America
- 5.5.1.1 United States
- 5.5.1.2 Canada
- 5.5.1.3 Mexico
- 5.5.2 Europe
- 5.5.2.1 Germany
- 5.5.2.2 United Kingdom
- 5.5.2.3 France
- 5.5.2.4 Italy
- 5.5.2.5 Spain
- 5.5.2.6 Russia
- 5.5.2.7 Rest of Europe
- 5.5.3 Asia-Pacific
- 5.5.3.1 China
- 5.5.3.2 India
- 5.5.3.3 Japan
- 5.5.3.4 South Korea
- 5.5.3.5 ASEAN Countries
- 5.5.3.6 Australia and New Zealand
- 5.5.3.7 Rest of Asia Pacific
- 5.5.4 South America
- 5.5.4.1 Brazil
- 5.5.4.2 Argentina
- 5.5.4.3 Chile
- 5.5.4.4 Rest of South America
- 5.5.5 Middle East and Africa
- 5.5.5.1 Saudi Arabia
- 5.5.5.2 United Arab Emirates
- 5.5.5.3 South Africa
- 5.5.5.4 Egypt
- 5.5.5.5 Rest of Middle East and Africa
- 5.5.1 North America
6 Competitive Landscape
- 6.1 Market Concentration
- 6.2 Strategic Moves (M&A, Partnerships, PPAs)
- 6.3 Market Share Analysis (Market Rank/Share for key companies)
- 6.4 Company Profiles (includes Global level Overview, Market level overview, Core Segments, Financials as available, Strategic Information, Products & Services, and Recent Developments)
- 6.4.1 Hitachi Energy Ltd.
- 6.4.2 Siemens Energy AG
- 6.4.3 Schneider Electric SE
- 6.4.4 Eaton Corporation plc
- 6.4.5 Mitsubishi Electric Corp.
- 6.4.6 CG Power & Industrial Solutions Ltd.
- 6.4.7 Bharat Heavy Electricals Ltd.
- 6.4.8 SPX Transformer Solutions Inc.
- 6.4.9 Wilson Transformer Co.
- 6.4.10 Prolec GE
- 6.4.11 Howard Industries Inc.
- 6.4.12 Toshiba Energy Systems & Solutions
- 6.4.13 Hyundai Electric & Energy Systems
- 6.4.14 TBEA Co. Ltd.
- 6.4.15 SGB-SMIT Group
- 6.4.16 ABB Ltd. (Smart Transformers)
- 6.4.17 Arteche Group
- 6.4.18 WEIDMANN Electrical Technology
- 6.4.19 Trench Group (Siemens)
7 Market Opportunities & Future Outlook
- 7.1 White-Space & Unmet-Need Assessment

