
PUBLISHER: Mordor Intelligence | PRODUCT CODE: 1906893

PUBLISHER: Mordor Intelligence | PRODUCT CODE: 1906893
Indonesia Oil And Gas - Market Share Analysis, Industry Trends & Statistics, Growth Forecasts (2026 - 2031)
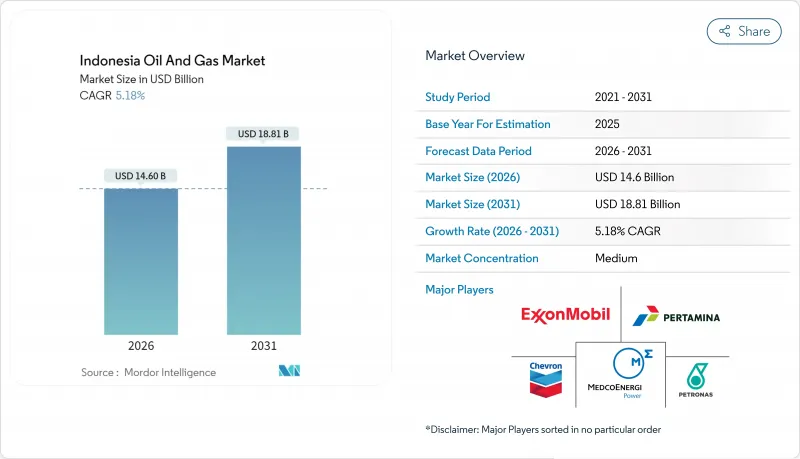
The Indonesia Oil And Gas market is expected to grow from USD 13.88 billion in 2025 to USD 14.6 billion in 2026 and is forecast to reach USD 18.81 billion by 2031 at 5.18% CAGR over 2026-2031.
This trajectory highlights how the Indonesian oil and gas market is shifting from long-mature onshore basins toward offshore growth, carbon capture integration, and digital transformation. Rising domestic demand, favorable production-sharing terms, and deep-water discoveries are widening capital flows into exploration while sustaining service revenues from maintenance and turnaround activities that keep aging infrastructure online. Competitive intensity is shaped by Pertamina's 60% share of national output, the return of international oil companies that leverage advanced recovery techniques, and escalating investment in CCUS hubs, which extend field life and lower lifecycle emissions. Offshore fields in the Natuna Sea, Abadi Masela, and Mahakam Delta are redefining project economics, with FPSOs and subsea tiebacks significantly shortening the time to first gas. Meanwhile, small-scale LNG solutions are broadening the market reach to remote islands and mining enclaves.
Indonesia Oil And Gas Market Trends and Insights
Robust Domestic Demand from Rising Middle Class
Indonesia's growing middle class is driving up gasoline, diesel, and petrochemical consumption, with daily crude demand projected to reach 1.8 million barrels by 2030, up from roughly 1.6 million barrels in 2025. Java's urbanization rate above 60% intensifies transport fuel use, despite efficiency drives, while rising personal incomes underpin higher demand for plastics and packaging. Natural gas demand is expected to reach 12 Bcf/d by 2030, as combined-cycle power plants supplement renewable energy intermittency and meet the needs of industrial boilers. Fuel-subsidy reforms redirect savings into roads, ports, and mass transit projects, which further spur energy needs, reinforcing the long-term pull for domestic hydrocarbons.
Government Push for 1 Million bbl/d Crude and 12 Bcf/d Gas by 2030
SKK Migas targets 1 million barrels per day (bbl/d) of oil and 12 billion cubic feet per day (Bcf/d) of gas to curb import dependence, which already covers 60% of refined-product demand. Priority accelerators include 127 blocks slated for fast-track approval, fiscal sweeteners for enhanced recovery, and digital field surveillance that lifts output from marginal reservoirs. Projects such as Abadi LNG and the Tangguh expansion underpin gas deliverability, whereas steamflood and chemical EOR initiatives at Minas and Duri slow base decline. The regulatory path features gross-split PSCs that streamline audits and guarantee earlier cash flow, attracting Chevron, Harbour Energy, and Medco into frontier acreage.
Renewable-Energy Build-Out and EV Adoption
Indonesia aims for 23% renewable energy penetration by 2025 and net-zero emissions by 2060, ambitions that redirect capital from fossil fuel projects into solar, wind, and geothermal units totaling 10 GW under construction. Fiscal incentives for EV assembly plants draw global OEMs to West Java, in line with a national goal of 2 million battery electric vehicles on the roads by 2030. While gas still balances intermittency, long-run gasoline demand faces attrition as charging networks densify across toll-road corridors. Yet infrastructure gaps and price sensitivity moderate short-term displacement, allowing the Indonesian oil and gas market to retain core transport and industrial segments.
Other drivers and restraints analyzed in the detailed report include:
- LNG Export Arbitrage to North-East Asia
- PSC Gross-Split Incentives Attracting IOCs
- Declining Output from Ageing Basins
For complete list of drivers and restraints, kindly check the Table Of Contents.
Segment Analysis
Indonesia's oil and gas market size for the upstream segment was USD 10.01 billion in 2025, accounting for 72.10% of the overall revenue and projected to grow at a 5.55% CAGR through 2031. Major capital commitments include BP's USD 7 billion Tangguh UCC and Inpex's USD 20 billion Abadi LNG project, signaling durable corporate confidence in long-cycle gas projects. Production-sharing reforms, digital subsurface imaging, and reservoir robotics enhance recovery rates from legacy wells, reinforcing upstream cash flow even as basins mature.
Gross-split PSCs heighten transparency, with cost certainty spurring Chevron's return to the Rapak Block and Harbour Energy's infill campaign at Tuna. Digital asset integrity systems deployed by Pertamina and FPT Software reduced unplanned shutdowns by 15%, demonstrating the operational advantage that AI integration provides. Midstream expansions-new pipelines linking Central Sulawesi to Java-protect evacuation economics, while downstream petrochemical integration at Tuban refinery monetizes heavier crudes into high-margin olefins.
The Indonesia Oil and Gas Market Report is Segmented by Sector (Upstream, Midstream, and Downstream), Location (Onshore and Offshore), and Service (Construction, Maintenance and Turn-Around, and Decommissioning). The Market Sizes and Forecasts are Provided in Terms of Value (USD).
List of Companies Covered in this Report:
- Pertamina
- Chevron
- ExxonMobil
- Shell
- BP
- Petronas
- ConocoPhillips
- Medco Energi
- Eni
- TotalEnergies
- Repsol
- Sinopec
- PGN
- Chandra Asri
- Inpex
- Mubadala Energy
- Harbour Energy
- Conrad Asia Energy
- PT Connusa Energindo
- CNOOC
Additional Benefits:
- The market estimate (ME) sheet in Excel format
- 3 months of analyst support
TABLE OF CONTENTS
1 Introduction
- 1.1 Study Assumptions & Market Definition
- 1.2 Scope of the Study
2 Research Methodology
3 Executive Summary
4 Market Landscape
- 4.1 Market Overview
- 4.2 Market Drivers
- 4.2.1 Robust domestic demand from rising middle class
- 4.2.2 Government push for 1 mb/d crude & 12 Bcf/d gas by 2030
- 4.2.3 LNG export arbitrage to North-East Asia
- 4.2.4 PSC gross-split incentives attracting IOCs
- 4.2.5 Carbon-capture hubs boosting mature-field economics
- 4.2.6 AI-enabled digital oilfields cutting lifting cost
- 4.3 Market Restraints
- 4.3.1 Renewable-energy build-out & EV adoption
- 4.3.2 Declining output from ageing basins
- 4.3.3 Land-right & indigenous community disputes
- 4.3.4 ESG-linked financing constraints
- 4.4 Supply-Chain Analysis
- 4.5 Regulatory Landscape
- 4.6 Technological Outlook
- 4.7 Crude-Oil Production & Consumption Outlook
- 4.8 Natural-Gas Production & Consumption Outlook
- 4.9 Installed Pipeline Capacity Analysis
- 4.10 Unconventional Resources CAPEX Outlook (tight oil, oil sands, deep-water)
- 4.11 LNG Terminal Capacity Outlook
- 4.12 Porter's Five Forces
- 4.12.1 Threat of New Entrants
- 4.12.2 Bargaining Power of Suppliers
- 4.12.3 Bargaining Power of Buyers
- 4.12.4 Threat of Substitutes
- 4.12.5 Competitive Rivalry
- 4.13 PESTLE Analysis
5 Market Size & Growth Forecasts
- 5.1 By Sector
- 5.1.1 Upstream
- 5.1.2 Midstream
- 5.1.3 Downstream
- 5.2 By Location
- 5.2.1 Onshore
- 5.2.2 Offshore
- 5.3 By Service
- 5.3.1 Construction
- 5.3.2 Maintenance and Turn-around
- 5.3.3 Decommissioning
6 Competitive Landscape
- 6.1 Market Concentration
- 6.2 Strategic Moves (M&A, Partnerships, PPAs)
- 6.3 Market Share Analysis (Market Rank/Share for key companies)
- 6.4 Company Profiles (includes Global level Overview, Market level overview, Core Segments, Financials as available, Strategic Information, Products & Services, and Recent Developments)
- 6.4.1 Pertamina
- 6.4.2 Chevron
- 6.4.3 ExxonMobil
- 6.4.4 Shell
- 6.4.5 BP
- 6.4.6 Petronas
- 6.4.7 ConocoPhillips
- 6.4.8 Medco Energi
- 6.4.9 Eni
- 6.4.10 TotalEnergies
- 6.4.11 Repsol
- 6.4.12 Sinopec
- 6.4.13 PGN
- 6.4.14 Chandra Asri
- 6.4.15 Inpex
- 6.4.16 Mubadala Energy
- 6.4.17 Harbour Energy
- 6.4.18 Conrad Asia Energy
- 6.4.19 PT Connusa Energindo
- 6.4.20 CNOOC
7 Market Opportunities & Future Outlook
- 7.1 White-space & Unmet-need Assessment

