
PUBLISHER: Mordor Intelligence | PRODUCT CODE: 1906993

PUBLISHER: Mordor Intelligence | PRODUCT CODE: 1906993
Lubricants - Market Share Analysis, Industry Trends & Statistics, Growth Forecasts (2026 - 2031)
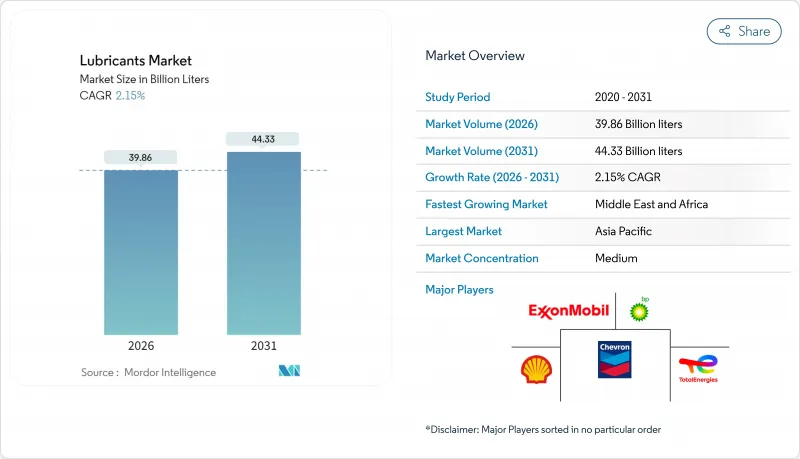
Lubricants Market size in 2026 is estimated at 39.86 billion liters, growing from 2025 value of 39.02 billion liters with 2031 projections showing 44.33 billion liters, growing at 2.15% CAGR over 2026-2031.
Demand is shifting from traditional mineral-oil grades toward higher-performance synthetics as environmental regulations tighten and OEMs seek viscosity downgrades for fuel economy gains. Simultaneously, new use cases, including wind-turbine gearboxes and electric-vehicle thermal management systems, create fresh revenue pools that offset slower growth in legacy internal combustion applications. Supply-chain risk for high-viscosity synthetic esters, potential internal-combustion bans in Europe, and increasingly stringent VOC limits in North America underscore a complex risk-reward landscape that rewards agile formulators with diversified portfolios. Competitive intensity continues to rise as national oil companies vertically integrate and global majors expand synthetic capacity to secure higher margins in premium niches.
Global Lubricants Market Trends and Insights
Surging Vehicle Parc-Especially in Emerging Asia
The rapid expansion of the on-road vehicle population in China and India is reshaping the lubricants market, with aftermarket demand in those two nations rising at 14.7% and 12.2% respectively, through 2030. Rising middle-income ownership of personal vehicles is accelerating the shift from conventional mineral oils to synthetics, which promise fuel-economy gains and longer service intervals. Compliance with India's TREM Stage IV-V standards further lifts demand for low-SAPs, premium formulations in the commercial-vehicle segment. Strong growth in agricultural machinery sales across South Asia also spurs demand for multi-grade, high-torque lubricants that withstand harsher duty cycles. Although absolute volume expansion moderates after 2029, the premiumization trend is expected to lift dollar revenues faster than liter volumes. Global suppliers that localize blending and leverage brand equity are positioned to benefit from this structural tailwind.
Expanding Power-Generation Build-Out (Gas-Turbine, Wind)
Ambitious renewable and gas-turbine projects worldwide generate steady demand for specialty lubricants engineered for extreme temperatures and long service intervals. A modern wind-turbine gearbox must run as long as 10 years without an oil change, requiring fully synthetic PAO-based fluids tailored to prevent white-etching cracks and micro-pitting. Gas turbines likewise rely on high-VI lubricants that retain viscosity at 200 °C, fostering demand for Group III and metallocene PAO basestocks. Offshore wind farms present salinity and moisture challenges, prompting operators to forge multi-year service contracts with lubricant suppliers that can guarantee equipment uptime. With relatively few suppliers qualifying under stringent OEM approvals, pricing power favors those who clear the certification bar.
Stringent Eco-Toxicity and VOC Norms on Mineral Oils
European REACH requirements and California's VOC regulations are forcing a pivot away from conventional mineral-oil lubricants toward synthetics and bio-based alternatives. California's latest Consumer-Products rulemaking aims to eliminate 21 tons per day of VOC emissions, directly impacting common lubricant-rich products such as brake cleaners. In Europe, the classification of lithium hydroxide monohydrate as a reproductive toxicant has triggered research and development investments in calcium-sulfonate and aluminum-complex grease technologies. These shifts are propelling the lubricants industry towards development of environmentally acceptable lubricants.
Other drivers and restraints analyzed in the detailed report include:
- OEM Viscosity-Grade Downgrading (0W-XX) Extends Drain Intervals
- Mainstream Electrification Still Needs Specialty Thermal Fluids
- Accelerated ICE Bans in Europe Cut Long-Term Engine-Oil Demand
For complete list of drivers and restraints, kindly check the Table Of Contents.
Segment Analysis
Group I basestocks retain the largest 42.15% share of the lubricants market size, but their lead is steadily shrinking as OEM specifications render higher-sulfur, lower-VI products obsolete. Group III output is scaling rapidly in the Asia-Pacific region, buoyed by new hydrocracking projects in Singapore and China that, together, will add more than 40,000 barrels per day of premium basestock supply by 2026.
The lubricants market is therefore recalibrating toward low-volatility, high-purity basestocks that enable 0W-16 and 0W-8 formulations, extending oil-drain intervals by up to 30%. Producers with integrated refining and additive capabilities capture cost synergies and restriction-proof supply chains. Meanwhile, Group IV PAOs command high margins in the aviation, aerospace, and wind turbine niches, where thermal stability and oxidative resistance are non-negotiable. Group V esters, though small in volume, underpin next-generation EV fluids, adding a diversification layer that cushions volume erosion in traditional segments.
Mineral oils still command 65.85% of 2025 volume despite multi-faceted headwinds. Cost competitiveness keeps them entrenched in price-sensitive markets such as agricultural equipment and two-wheeler maintenance, especially across Southeast Asia and Africa.
Yet the lubricants market share of synthetic and semi-synthetic products is set to climb as sustainability mandates, OEM specs, and total-cost-of-ownership calculators gain prominence. Bio-based lubricants, expanding at 3.21% CAGR, are increasingly adopted in applications with environmental sensitivity, think forestry, marine decks, and food-processing machinery, where accidental leakage poses ecological risk. Obstacles remain: oxidative stability and cold-flow limits hinder broader adoption, and supply security for vegetable-oil feedstocks is complicated by competition with food uses. Nevertheless, tax incentives and green-procurement rules in Europe and parts of North America are closing the price gap, nudging mineral oil users toward sustainable substitutes.
The Lubricants Report is Segmented by Group (Group I, Group II, Group III, Group IV, and Group V), Base Stock (Mineral-Oil, Synthetic, Semi-Synthetic, and Bio-Based), Product Type (Engine Oils, Transmission and Gear Oils, Hydraulic Fluids, Metalworking Fluids, and More), End-User Industry (Automotive, Power Generation, Heavy Equipment, and More), and Geography (Asia-Pacific, North America, Europe, and More).
Geography Analysis
The Asia-Pacific's 45.10% lubricants market share is driven by trends amplified by the growth of middle-class vehicle ownership and stringent local emissions standards, which are pulling higher-spec products into the mainstream. Strategic capacity expansions, ExxonMobil's Singapore Resid Upgrade, Chevron Oronite's Ningbo project, and Shell's Thailand grease plant tripling output-fortify supply resilience in the region.
Middle East and Africa, though smaller in absolute terms, leads volumetric expansion at 3.19% through 2031. The UAE and Saudi Arabia are pairing new refining ventures with downstream lube blending, targeting high-growth markets such as Nigeria and Kenya, where industrialization is gathering pace in the lubricants industry. Europe and North America operate under mature market dynamics: restrictive emissions policies catalyze migration to synthetics and bio-based grades, while shale-advantaged basestock supply in the United States supports domestic blending economics. Latin America sits in transition; infrastructure spending and a rebounding automotive sector place the lubricants market on a moderate upward slope, though policy instability dampens long-term forecasts.
- BP PLC
- Chevron Corporation
- China National Petroleum Corporation (CNPC)
- China Petroleum & Chemical Corporation (SINOPEC)
- ENEOS Corporation
- Exxon Mobil Corporation
- FUCHS
- Hindustan Petroleum Corporation Limited
- Idemitsu Kosan Co. Ltd
- Indian Oil Corporation Ltd
- LUKOIL
- MOTUL
- Petromin
- PETRONAS Lubricants International
- Phillips 66 Company
- PT Pertamina Lubricants
- Repsol
- Shell Plc
- TotalEnergies
- VALVOLINE INC.
Additional Benefits:
- The market estimate (ME) sheet in Excel format
- 3 months of analyst support
TABLE OF CONTENTS
1 Introduction
- 1.1 Study Assumptions and Market Definition
- 1.2 Scope of the Study
2 Research Methodology
3 Executive Summary
4 Market Landscape
- 4.1 Market Overview
- 4.2 Market Drivers
- 4.2.1 Surging Vehicle Parc - Especially in Emerging Asia
- 4.2.2 Expanding Power-Generation Build-Out (Gas-Turbine, Wind)
- 4.2.3 OEM Viscosity-Grade Downgrading (0W-XX) Extends Drain Intervals
- 4.2.4 Mainstream Electrification Still Needs Specialty Thermal Fluids
- 4.2.5 AI-Enabled Predictive Maintenance Boosts Premium Industrial Oils
- 4.3 Market Restraints
- 4.3.1 Stringent Eco-Toxicity and VOC Norms on Mineral Oils
- 4.3.2 Accelerated ICE Bans in Europe Cut Long-Term Engine-Oil Demand
- 4.3.3 Supply-Risk of High-VI Synthetic Esters (Aviation, EV)
- 4.4 Value Chain Analysis
- 4.5 Porter's Five Forces
- 4.5.1 Bargaining Power of Suppliers
- 4.5.2 Bargaining Power of Buyers
- 4.5.3 Threat of New Entrants
- 4.5.4 Threat of Substitutes
- 4.5.5 Degree of Competition
5 Market Size and Growth Forecasts (Value and Volume)
- 5.1 By Group
- 5.1.1 Group I
- 5.1.2 Group II
- 5.1.3 Group III
- 5.1.4 Group IV
- 5.1.5 Group V
- 5.2 By Base Stock
- 5.2.1 Mineral-oil Lubricants
- 5.2.2 Synthetic Lubricants
- 5.2.3 Semi-synthetic Lubricants
- 5.2.4 Bio-based Lubricants
- 5.3 By Product Type
- 5.3.1 Engine Oils
- 5.3.2 Transmission and Gear Oils
- 5.3.3 Hydraulic Fluids
- 5.3.4 Metalworking Fluids
- 5.3.5 Greases
- 5.3.6 Other Product Types
- 5.4 By End-user Industry
- 5.4.1 Automotive
- 5.4.2 Power Generation
- 5.4.3 Heavy Equipment
- 5.4.4 Metallurgy and Metalworking
- 5.4.5 Other End-user Industries
- 5.5 By Geography
- 5.5.1 Asia-Pacific
- 5.5.1.1 China
- 5.5.1.2 India
- 5.5.1.3 Japan
- 5.5.1.4 South Korea
- 5.5.1.5 Indonesia
- 5.5.1.6 Thailand
- 5.5.1.7 Malaysia
- 5.5.1.8 Vietnam
- 5.5.1.9 Rest of Asia-Pacific
- 5.5.2 North America
- 5.5.2.1 United States
- 5.5.2.2 Canada
- 5.5.2.3 Mexico
- 5.5.3 Europe
- 5.5.3.1 Germany
- 5.5.3.2 United Kingdom
- 5.5.3.3 France
- 5.5.3.4 Italy
- 5.5.3.5 Spain
- 5.5.3.6 Nordics
- 5.5.3.7 Turkey
- 5.5.3.8 Russia
- 5.5.3.9 Rest of Europe
- 5.5.4 South America
- 5.5.4.1 Brazil
- 5.5.4.2 Argentina
- 5.5.4.3 Colombia
- 5.5.4.4 Rest of South America
- 5.5.5 Middle-East and Africa
- 5.5.5.1 Saudi Arabia
- 5.5.5.2 United Arab Emirates
- 5.5.5.3 Qatar
- 5.5.5.4 Nigeria
- 5.5.5.5 South Africa
- 5.5.5.6 Egypt
- 5.5.5.7 Rest of Middle-East and Africa
- 5.5.1 Asia-Pacific
6 Competitive Landscape
- 6.1 Market Concentration
- 6.2 Strategic Moves
- 6.3 Market Share (%)/Ranking Analysis
- 6.4 Company Profiles (includes Global level Overview, Market level overview, Core Segments, Financials as available, Strategic Information, Market Rank/Share for key companies, Products and Services, and Recent Developments)
- 6.4.1 BP PLC
- 6.4.2 Chevron Corporation
- 6.4.3 China National Petroleum Corporation (CNPC)
- 6.4.4 China Petroleum & Chemical Corporation (SINOPEC)
- 6.4.5 ENEOS Corporation
- 6.4.6 Exxon Mobil Corporation
- 6.4.7 FUCHS
- 6.4.8 Hindustan Petroleum Corporation Limited
- 6.4.9 Idemitsu Kosan Co. Ltd
- 6.4.10 Indian Oil Corporation Ltd
- 6.4.11 LUKOIL
- 6.4.12 MOTUL
- 6.4.13 Petromin
- 6.4.14 PETRONAS Lubricants International
- 6.4.15 Phillips 66 Company
- 6.4.16 PT Pertamina Lubricants
- 6.4.17 Repsol
- 6.4.18 Shell Plc
- 6.4.19 TotalEnergies
- 6.4.20 VALVOLINE INC.
7 Market Opportunities and Future Outlook
- 7.1 White-space and Unmet-Need Assessment
- 7.2 Growing Adoption of Bio-lubricants

