
PUBLISHER: Mordor Intelligence | PRODUCT CODE: 1910561

PUBLISHER: Mordor Intelligence | PRODUCT CODE: 1910561
E-Retail - Market Share Analysis, Industry Trends & Statistics, Growth Forecasts (2026 - 2031)
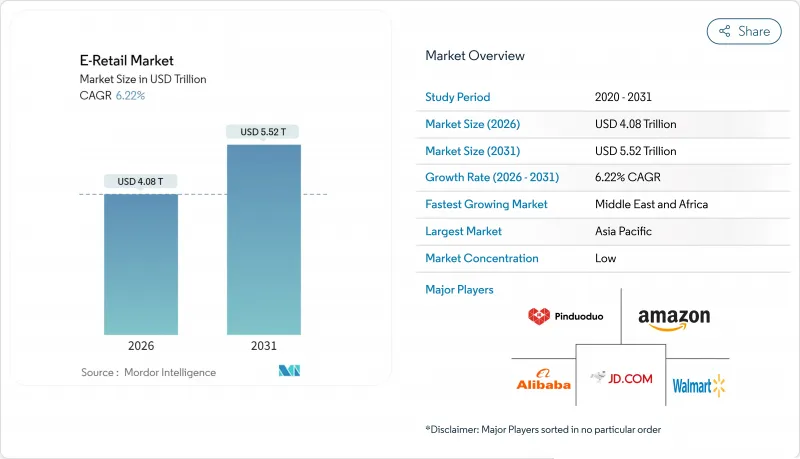
E-Retail market size in 2026 is estimated at USD 4078.85 billion, growing from 2025 value of USD 3840 billion with 2031 projections showing USD 5517.3 billion, growing at 6.22% CAGR over 2026-2031.
Rapid smartphone adoption, pervasive mobile internet, and secure digital payments underpin resilient demand even as macroeconomic conditions fluctuate. Live-streaming social-commerce formats attract incremental traffic and drive impulse purchases, while cross-border logistics networks shorten delivery windows and expand product availability. AI-driven hyper-personalization strengthens conversion rates in tier-2 and tier-3 cities, and embedded finance tools such as BNPL lift average order values. Together, these forces position the E-Retail market as a prime beneficiary of ongoing digital transformation across consumer segments.
Global E-Retail Market Trends and Insights
Proliferation of Smartphones & Low-Cost Mobile Internet
Smartphones now serve as the primary retail interface, accounting for more than 70% of global E-Retail transactions. Fifth-generation networks and edge computing enable real-time content personalization and AR try-ons that deepen engagement. Social platforms such as TikTok integrate native checkout links, funneling mobile traffic directly to merchants. Advanced analytics optimize on-device experiences by tailoring recommendations and promotions to behavioral signals. Mobile wallets and contactless payments trim checkout friction, reinforcing smartphone dominance in the E-Retail market.
Expansion of Secure Digital Payment Infrastructure
Tokenization and biometric authentication have driven fraud down and boosted consumer confidence, encouraging higher-value digital purchases. Real-time rails accelerate settlement, enabling same-day grocery and micro-transaction business models. Open-banking APIs let merchants embed credit, insurance, and loyalty services inside checkout flows, lengthening customer lifetime value. Blockchain-enabled cross-border payments cut fees and enhance transparency for SMEs selling internationally. Regulators in Latin America and Africa now champion instant-payment frameworks, extending infrastructure benefits to traditionally under-banked populations.
Carbon-Footprint Rules Curbing Free Returns
European regulators now mandate detailed emissions disclosure on parcel flows, forcing platforms to rethink liberal return policies that once differentiated the E-Retail market. Reverse-logistics miles drive up carbon tallies, so leading merchants pilot consolidated pickup schedules and recyclable packaging to trim footprints. Consumers increasingly accept "green returns" that bundle items into fewer shipments, but stricter rules still raise handling costs and erode margins. Platforms invest in AI sizing tools and virtual try-ons to lower return rates at the source, protecting profitability while meeting new standards. North American and APAC policymakers study similar measures, signaling broader cost pressure over the medium term.
Other drivers and restraints analyzed in the detailed report include:
- Growth of Cross-Border E-Commerce Logistics Networks
- Rising Preference for Convenience & On-Demand Retail
- Cookieless Future Hurting Ad-Targeting Accuracy
For complete list of drivers and restraints, kindly check the Table Of Contents.
Segment Analysis
Clothing, Footwear & Accessories delivered 22.88% of the E-Retail market share in 2025, reaffirming fashion's primacy within overall digital spend. AI trend engines and rapid-cycle manufacturing let platforms surface micro-styles before brick-and-mortar rivals respond, deepening category stickiness. Food & Grocery is the fastest riser at a 13.06% CAGR through 2031, signaling the structural shift toward online replenishment and same-day fulfillment for staples. Virtual try-ons and AR furniture previews reduce return friction across apparel and home decor, while recommerce options extend product life and court sustainability-minded shoppers. Together, these shifts broaden the E-Retail market and seed incremental revenue streams beyond core fashion.
Continuous innovation spreads quickly across adjacent categories, underscoring how fashion tactics now influence electronics, beauty, and even automotive accessories in the E-Retail market. Subscription boxes anchor predictable demand curves and elevate customer lifetime value, especially in consumables. Predictive analytics aligns inventory with social-media buzz, guarding margins against markdown risk. Circular-economy programs such as certified refurbishment in electronics shrink waste and monetize secondary sales, adding diversity to the E-Retail market size. Private-label expansion further insulates platforms from supplier power and sustains differentiation.
The E-Retail Market is Segmented by Product (home Appliances and Electronics, and Other), by Platform Type (Marketplace Platforms, Direct-To-Consumer Brand Stores, and Other), by Device ( Mobile, Desktop & Tablet, and Other), by Geography (North America, and Other). The Market Forecasts are Provided in Terms of Value (USD).
Geography Analysis
Asia-Pacific accounted for 59.78% of the E-Retail market size in 2025 thanks to dense urban populations, mobile wallet ubiquity, and proactive digital-economy policies. Super-app ecosystems merge payments, chat, and shopping so seamlessly that first-time users convert rapidly, reinforcing network lock-in across categories. Government-backed logistics corridors and bonded-warehouse zones cut cross-border delivery times, driving incremental spend from neighboring countries. Live-stream commerce originating in China diffuses across Southeast Asia, spurring regional sellers to localize influencer content. Meanwhile, domestic rivals in India inject competitive pricing and vernacular-language interfaces, widening access for tier-3 city shoppers.
North America remains a high-value but mature arena where same-day delivery promises and subscription bundles sustain loyalty amid saturation. Investments in robotics and micro-fulfillment help offset rising labor costs, maintaining competitive unit economics. Regulatory scrutiny around antitrust and data privacy nudges incumbents to open ad networks and extend fulfilment services to external merchants, subtly reshaping E-Retail market share dynamics. Cross-border flows with Canada and Mexico intensify under streamlined USMCA digital trade provisions, improving assortment variety for border-state consumers. Sustainability mandates on packaging push retailers toward right-size boxing, trimming both emissions and dimensional-weight fees.
Europe balances opportunity with complexity: multilingual markets and new Digital Services Act obligations raise compliance thresholds but also standardize consumer protections that build trust. Pan-EU payment harmonization under the European Payments Initiative narrows friction for cross-member-state transactions. Marketplace players navigate carbon-adjusted shipping fees that vary by destination, factoring emission costs into dynamic pricing. Local champions in fashion and housewares leverage cultural cachet and "made-in-EU" branding to counter U.S. and Chinese platforms. Geopolitical uncertainties around data transfers necessitate robust EU-based cloud architectures, increasing capital outlays but safeguarding market access.
- Amazon.com Inc.
- Alibaba Group Holding Ltd.
- JD.com Inc.
- Walmart Inc.
- eBay Inc.
- Rakuten Group Inc.
- Shopify Inc.
- MercadoLibre Inc.
- Flipkart Internet Pvt Ltd
- Zalando SE
- Coupang Inc.
- Otto Group
- Sea Ltd (Shopee)
- ASOS Plc
- Pinduoduo Inc.
- Wayfair Inc.
- Lazada Group
- Etsy Inc.
- bol.com (Ahold Delhaize)
- Noon.com
Additional Benefits:
- The market estimate (ME) sheet in Excel format
- 3 months of analyst support
TABLE OF CONTENTS
1 Introduction
- 1.1 Study Assumptions & Market Definition
- 1.2 Scope of the Study
2 Research Methodology
3 Executive Summary
4 Market Landscape
- 4.1 Market Overview
- 4.2 Market Drivers
- 4.2.1 Proliferation of smartphones & low-cost mobile internet
- 4.2.2 Expansion of secure digital payment infrastructure
- 4.2.3 Growth of cross-border e-commerce logistics networks
- 4.2.4 Rising preference for convenience & on-demand retail
- 4.2.5 Social-commerce live-streaming-led impulse purchases
- 4.2.6 AI-powered hyper-personalisation in tier-2/3 cities
- 4.3 Market Restraints
- 4.3.1 Cyber-security & data-privacy concerns
- 4.3.2 High last-mile delivery costs in rural areas
- 4.3.3 Carbon-footprint rules curbing free returns
- 4.3.4 Cookieless future hurting ad-targeting accuracy
- 4.4 Value / Supply-Chain Analysis
- 4.5 Regulatory Landscape
- 4.6 Technological Outlook
- 4.7 Porter's Five Forces
- 4.7.1 Threat of New Entrants
- 4.7.2 Bargaining Power of Buyers
- 4.7.3 Bargaining Power of Suppliers
- 4.7.4 Threat of Substitutes
- 4.7.5 Competitive Rivalry
5 Market Size & Growth Forecasts
- 5.1 By Product
- 5.1.1 Home Appliances & Electronics
- 5.1.2 Clothing, Footwear & Accessories
- 5.1.3 Food & Personal Care
- 5.1.4 Furniture & Home Decor
- 5.1.5 Other Products
- 5.2 By Platform Type
- 5.2.1 Marketplace Platforms
- 5.2.2 Direct-to-Consumer Brand Stores
- 5.2.3 Omnichannel Retailer E-Stores
- 5.2.4 Subscription & Flash-Sales Platforms
- 5.2.5 Social-Commerce Platforms
- 5.3 By Device
- 5.3.1 Mobile
- 5.3.2 Desktop & Tablet
- 5.3.3 Connected TV & Smart Devices
- 5.3.4 Others
- 5.4 By Geography
- 5.4.1 North America
- 5.4.1.1 Canada
- 5.4.1.2 United States
- 5.4.1.3 Mexico
- 5.4.2 South America
- 5.4.2.1 Brazil
- 5.4.2.2 Peru
- 5.4.2.3 Chile
- 5.4.2.4 Argentina
- 5.4.2.5 Rest of South America
- 5.4.3 Europe
- 5.4.3.1 United Kingdom
- 5.4.3.2 Germany
- 5.4.3.3 France
- 5.4.3.4 Spain
- 5.4.3.5 Italy
- 5.4.3.6 BENELUX (Belgium, Netherlands, Luxembourg)
- 5.4.3.7 NORDICS (Denmark, Finland, Iceland, Norway, Sweden)
- 5.4.3.8 Rest of Europe
- 5.4.4 Asia-Pacific
- 5.4.4.1 India
- 5.4.4.2 China
- 5.4.4.3 Japan
- 5.4.4.4 Australia
- 5.4.4.5 South Korea
- 5.4.4.6 South-East Asia (SG, MY, TH, ID, VN, PH)
- 5.4.4.7 Rest of Asia-Pacific
- 5.4.5 Middle East & Africa
- 5.4.5.1 United Arab Emirates
- 5.4.5.2 Saudi Arabia
- 5.4.5.3 South Africa
- 5.4.5.4 Nigeria
- 5.4.5.5 Rest of Middle East & Africa
- 5.4.1 North America
6 Competitive Landscape
- 6.1 Market Concentration
- 6.2 Strategic Moves
- 6.3 Market Share Analysis
- 6.4 Company Profiles (includes Global level Overview, Market level overview, Core Segments, Financials as available, Strategic Information, Market Rank/Share for key companies, Products & Services, and Recent Developments)
- 6.4.1 Amazon.com Inc.
- 6.4.2 Alibaba Group Holding Ltd.
- 6.4.3 JD.com Inc.
- 6.4.4 Walmart Inc.
- 6.4.5 eBay Inc.
- 6.4.6 Rakuten Group Inc.
- 6.4.7 Shopify Inc.
- 6.4.8 MercadoLibre Inc.
- 6.4.9 Flipkart Internet Pvt Ltd
- 6.4.10 Zalando SE
- 6.4.11 Coupang Inc.
- 6.4.12 Otto Group
- 6.4.13 Sea Ltd (Shopee)
- 6.4.14 ASOS Plc
- 6.4.15 Pinduoduo Inc.
- 6.4.16 Wayfair Inc.
- 6.4.17 Lazada Group
- 6.4.18 Etsy Inc.
- 6.4.19 bol.com (Ahold Delhaize)
- 6.4.20 Noon.com
7 Market Opportunities & Future Outlook
- 7.1 Embedded finance & BNPL monetisation
- 7.2 Circular-commerce platforms for recommerce & rentals

