
PUBLISHER: Mordor Intelligence | PRODUCT CODE: 1910678

PUBLISHER: Mordor Intelligence | PRODUCT CODE: 1910678
Nuclear Power - Market Share Analysis, Industry Trends & Statistics, Growth Forecasts (2026 - 2031)
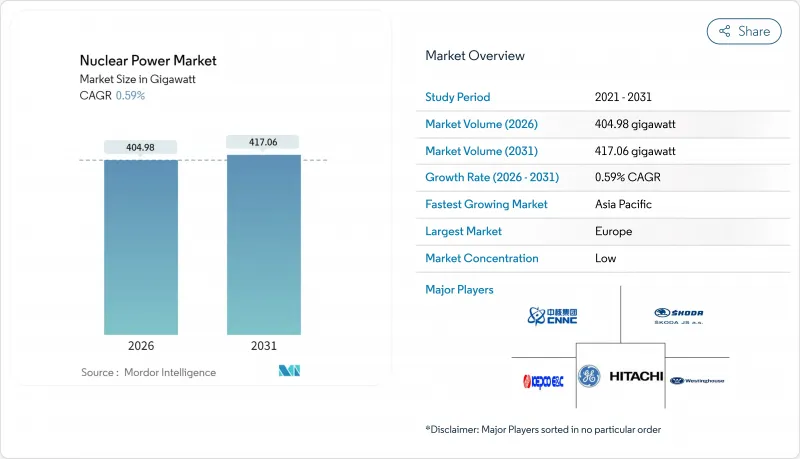
The Nuclear Power market is expected to grow from 402.60 gigawatt in 2025 to 404.98 gigawatt in 2026 and is forecast to reach 417.06 gigawatt by 2031 at 0.59% CAGR over 2026-2031.
Sustained capacity additions remain modest, yet the sector is undergoing a structural transition in which lifetime-extension programs shore up existing baseload generation even as small modular reactors (SMRs) move from the development stage toward commercial roll-out. Developers are focusing on factory-built modules to mitigate construction risk, while traditional gigawatt-scale projects contend with rising capital costs, lengthy lead times, and stricter financing rules. Regional dynamics are shaped by Europe's large installed base, the Asia-Pacific's rapid build-out pace, and North America's focus on life extension. Opportunities also arise from industrial decarbonization needs, where high-temperature nuclear process heat can displace coal and natural-gas boilers in the steel, cement, and chemicals industries.
Global Nuclear Power Market Trends and Insights
Increase in Demand for Clean Baseload Power
Electric-sector decarbonization targets continue to tighten, and grid managers struggle to integrate large shares of variable renewable energy sources without eroding reliability. Governments, therefore, revisit nuclear as a 24/7 carbon-free source, especially for data-center clusters whose electricity use rises 15-20% each year. Several economies that once planned to phase out nuclear power, such as Japan and South Korea, are reversing course to safeguard energy security. Capacity-value payments and ancillary-service revenues now feature in nuclear business cases, narrowing the apparent cost gap with solar and wind. The nuclear power market thereby secures a policy floor even where spot electricity prices remain volatile. At the same time, regulators insist on stricter safety margins, which lengthen licensing reviews while also reinforcing public acceptance.
Lifetime Extension & Uprate Programs
Operators find that keeping a 40-year-old reactor running for 60 or even 80 years costs USD 500-1,000 per kW, a fraction of the USD 6,000-12,000 per kW needed for new construction. The U.S. Nuclear Regulatory Commission has granted 95 license renewals, while France's EUR 49.4 billion grand carenage project strengthens containment structures and replaces key components. Uprating turbines and core internals typically adds 4-7% capacity per unit, making these projects the swiftest way to expand the nuclear power market without new siting battles. Operators must still address the embrittlement of reactor pressure vessels and the obsolescence of instrumentation. Uncertainty about regulations beyond 60 years weighs on longer-range planning; yet, most utilities view life extension as a bridge to advanced-reactor deployment in the 2030s.
Cost Overruns & Financing Challenges
The Vogtle 3-4 expansion in Georgia has more than doubled its initial budget to USD 35 billion, and Hinkley Point C in the United Kingdom now stands at nearly USD 43 billion. Such overruns stem from supply-chain gaps, design changes during construction, and the loss of skilled labor after decades of limited new build. Lenders, therefore, demand sovereign guarantees, regulated asset-based models, or long-term power-purchase agreements before committing funds. Developers pursue modularization to compress schedules; yet, first-of-a-kind SMRs must still demonstrate credible cost curves. Government loan guarantees and tax incentives mitigate risk, but merchant nuclear projects remain rare.
Other drivers and restraints analyzed in the detailed report include:
- Commercialization of Advanced SMRs
- Industrial Decarbonization Process-Heat Demand
- Competition from Low-Cost Renewables
For complete list of drivers and restraints, kindly check the Table Of Contents.
Segment Analysis
Pressurized light-water reactors accounted for 74.02% of total capacity in 2025, solidifying their role as the backbone of the nuclear power market. Fast breeder reactors, however, are on track for a 19.4% CAGR through 2031, propelled by China's 600 MWe CFR-600 and India's prototype reactor programs. Although gas-cooled and molten-salt concepts remain at the pilot stage, their high-temperature capabilities attract industrial heat clients.
The nuclear power market, therefore, sees light-water designs maintaining share in the medium term, while demonstration fast reactors build the knowledge base for closed-fuel cycles. Regulators gain familiarity with sodium and lead-coolant systems, but commercial financing hinges on early successes that demonstrate safety and economic viability. Should the CFR-600 hit performance milestones, breeder technologies may capture a meaningful nuclear power market share in the 2030s.
Medium-scale 500-1,000 MWe units held 48.12% of the installed capacity in 2025 and remain the preferred option for countries with mature grids. Small reactors under 500 MWe are forecast to expand at a 19.2% CAGR, reflecting utility interest in modular additions that lower capital at-risk. Micro-reactors with a capacity below 20 MWe target mining and defense applications, offering off-grid resilience.
Factory production is crucial to the economics of small reactors. Vendors pursue standardization so that the nuclear power market size for SMRs benefits from learning-curve cost declines after 10-12 units are in operation. Meanwhile, large reactors exceeding 1,000 MWe face cost headwinds and grid integration limits in smaller countries, curbing new orders outside China and India.
The Nuclear Power Market Report is Segmented by Reactor Type (Pressurized Light-Water Moderated and Cooled Reactor, Fast Breeder Reactor, and More), Reactor Size (Large, Medium, and Small), Fuel Type (Low-Enriched Uranium, and More), Application (Grid-Connected Power, Industrial Process Heat and Steam, and More), End-User (Utilities and IPPs, Industrial and Petro-Chemical, and More), and Geography (Europe, Asia-Pacific, and More).
Geography Analysis
Europe retained the largest 39.35% share of the nuclear power market in 2025, buoyed by France's 56-reactor fleet, which supplies 65% of the country's electricity. The European Union includes nuclear energy as a transitional asset under its green taxonomy, unlocking sustainable finance channels. Yet lifetime-extension costs and post-Fukushima upgrades strain operator balance sheets, and Germany's 2023 shutdown leaves Central Europe more reliant on French exports. The United Kingdom advances the 3.2 GW Hinkley Point C and explores a fleet of six EPRs that will sustain domestic nuclear skills through 2050.
Asia-Pacific delivers the fastest 6.6% CAGR, led by China's pipeline of 24 reactors under construction and India's indigenous PHWR and fast-reactor programs. China aligns its nuclear growth with its 2060 carbon neutrality pledge and targets 120 GW by 2030. Japan's gradual restarts lift capacity factors but remain constrained by public skepticism, while South Korea maintains a 28-reactor fleet and exports APR-1400 units to the United Arab Emirates. Emerging economies, such as Vietnam and Indonesia, conduct feasibility studies; however, financing and regulatory readiness remain hurdles before they can join the nuclear power market.
North America opts for life extension and selective new build. The United States relies on nuclear power for 20% of its total generation and 50% of its carbon-free power. License renewals keep aging plants online, while federal tax credits and loan guarantees encourage SMR projects in Idaho and Wyoming. Canada refurbishes its CANDU fleet, adding 881 MWe from Darlington unit 2 in 2024, and advances SMR demonstrations for remote Arctic communities and heavy-oil sites. Mexico retains its two-unit Laguna Verde plant with no new build on the horizon. Across the region, deployment pathways for advanced reactors hinge on HALEU supply and streamlined licensing.
- Electricite de France SA (EDF)
- Rosatom State Atomic Energy Corporation
- China National Nuclear Corporation (CNNC)
- Westinghouse Electric Company LLC
- GE-Hitachi Nuclear Energy
- Framatome SA
- Mitsubishi Heavy Industries Ltd
- Korea Hydro & Nuclear Power / KEPCO E&C
- BWX Technologies Inc.
- Bechtel Corporation
- Doosan Enerbility Co. Ltd
- Fluor Corporation (NuScale)
- SKODA JS a.s.
- Holtec International
- TerraPower LLC
- Rolls-Royce SMR Ltd
- X-Energy LLC
- General Fusion Inc.
- Ontario Power Generation
- Babcock International Group
- Bilfinger SE
- Duke Energy Corporation
- Japan Atomic Power Company
- Ansaldo Nucleare
Additional Benefits:
- The market estimate (ME) sheet in Excel format
- 3 months of analyst support
TABLE OF CONTENTS
1 Introduction
- 1.1 Study Assumptions & Market Definition
- 1.2 Scope of the Study
2 Research Methodology
3 Executive Summary
4 Market Landscape
- 4.1 Market Overview
- 4.2 Market Drivers
- 4.2.1 Increase in demand for clean baseload power
- 4.2.2 Lifetime extension & uprate programs
- 4.2.3 Commercialization of advanced SMRs
- 4.2.4 Industrial decarbonization process-heat demand
- 4.2.5 Nuclear-produced hydrogen & ammonia initiatives
- 4.2.6 Emergence of nuclear-powered data-center & marine applications
- 4.3 Market Restraints
- 4.3.1 Cost overruns & financing challenges
- 4.3.2 Competition from low-cost renewables
- 4.3.3 HALEU fuel-supply bottlenecks
- 4.3.4 Export-control & proliferation scrutiny
- 4.4 Supply-Chain Analysis
- 4.5 Regulatory Landscape
- 4.6 Technological Outlook
- 4.7 Porters Five Forces
- 4.7.1 Bargaining Power of Suppliers
- 4.7.2 Bargaining Power of Buyers
- 4.7.3 Threat of New Entrants
- 4.7.4 Threat of Substitutes
- 4.7.5 Intensity of Rivalry
5 Market Size & Growth Forecasts
- 5.1 By Reactor Type
- 5.1.1 Pressurized Light-Water Moderated and Cooled Reactor (PWR)
- 5.1.2 Pressurized Heavy-Water Moderated and Cooled Reactor (PHWR)
- 5.1.3 Boiling Light-Water Cooled and Moderated Reactor (BWR)
- 5.1.4 Gas Cooled, Graphite Moderated Reactor (GCR)
- 5.1.5 High-Temperature Gas-Cooled Reactor (HTGR)
- 5.1.6 Light-Water Cooled, Graphite Moderated Reactor (LWGR)
- 5.1.7 Fast Breeder Reactor (FBR)
- 5.1.8 Others
- 5.2 By Reactor Size
- 5.2.1 Large (Above 1,000 MWe)
- 5.2.2 Medium (500 to 1,000 MWe)
- 5.2.3 Small (Below 500 Mwe; includes SMRs and Micro-reactors)
- 5.3 By Fuel Type
- 5.3.1 Low-Enriched Uranium (Below 5% U-235)
- 5.3.2 High-Assay LEU (5 to 20% U-235)
- 5.3.3 Mixed Oxide (MOX)
- 5.3.4 Thorium-based Fuels
- 5.4 By Application
- 5.4.1 Grid-Connected Power
- 5.4.2 Off-grid/Remote Electrification
- 5.4.3 Industrial Process Heat and Steam
- 5.4.4 Desalination and District Heating
- 5.4.5 Defense and Military Bases
- 5.5 By End-User Sector
- 5.5.1 Utilities and IPPs
- 5.5.2 Industrial and Petro-chemical
- 5.5.3 Mining and Remote Operations
- 5.5.4 Government/Defense
- 5.5.5 Research Institutions
- 5.6 By Geography
- 5.6.1 North America
- 5.6.1.1 United States
- 5.6.1.2 Canada
- 5.6.1.3 Mexico
- 5.6.2 Europe
- 5.6.2.1 United Kingdom
- 5.6.2.2 France
- 5.6.2.3 Sweden
- 5.6.2.4 Spain
- 5.6.2.5 Ukraine
- 5.6.2.6 Russia
- 5.6.2.7 Rest of Europe
- 5.6.3 Asia-Pacific
- 5.6.3.1 China
- 5.6.3.2 India
- 5.6.3.3 Japan
- 5.6.3.4 South Korea
- 5.6.3.5 Rest of Asia-Pacific
- 5.6.4 South America
- 5.6.4.1 Brazil
- 5.6.4.2 Argentina
- 5.6.4.3 Rest of South America
- 5.6.5 Middle East and Africa
- 5.6.5.1 United Arab Emirates
- 5.6.5.2 South Africa
- 5.6.5.3 Egypt
- 5.6.5.4 Rest of Middle East and Africa
- 5.6.1 North America
6 Competitive Landscape
- 6.1 Market Concentration
- 6.2 Strategic Moves (M&A, JVs, Funding, PPAs)
- 6.3 Market Share Analysis (Market Rank/Share for key companies)
- 6.4 Company Profiles (includes Global-level Overview, Market-level Overview, Core Segments, Financials, Strategic Information, Products & Services, Recent Developments)
- 6.4.1 Electricite de France SA (EDF)
- 6.4.2 Rosatom State Atomic Energy Corporation
- 6.4.3 China National Nuclear Corporation (CNNC)
- 6.4.4 Westinghouse Electric Company LLC
- 6.4.5 GE-Hitachi Nuclear Energy
- 6.4.6 Framatome SA
- 6.4.7 Mitsubishi Heavy Industries Ltd
- 6.4.8 Korea Hydro & Nuclear Power / KEPCO E&C
- 6.4.9 BWX Technologies Inc.
- 6.4.10 Bechtel Corporation
- 6.4.11 Doosan Enerbility Co. Ltd
- 6.4.12 Fluor Corporation (NuScale)
- 6.4.13 SKODA JS a.s.
- 6.4.14 Holtec International
- 6.4.15 TerraPower LLC
- 6.4.16 Rolls-Royce SMR Ltd
- 6.4.17 X-Energy LLC
- 6.4.18 General Fusion Inc.
- 6.4.19 Ontario Power Generation
- 6.4.20 Babcock International Group
- 6.4.21 Bilfinger SE
- 6.4.22 Duke Energy Corporation
- 6.4.23 Japan Atomic Power Company
- 6.4.24 Ansaldo Nucleare
7 Market Opportunities & Future Outlook
- 7.1 White-space & Unmet-Need Assessment
- 7.2 Advanced Small Modular Reactors
- 7.3 Floating Nuclear Plants
- 7.4 Nuclear Hydrogen & Ammonia Production
- 7.5 Data-Center & Marine Micro-reactors
- 7.6 Lifetime Extension Services Market
- 7.7 Decommissioning & Waste-Management Services

