
PUBLISHER: Mordor Intelligence | PRODUCT CODE: 1910897

PUBLISHER: Mordor Intelligence | PRODUCT CODE: 1910897
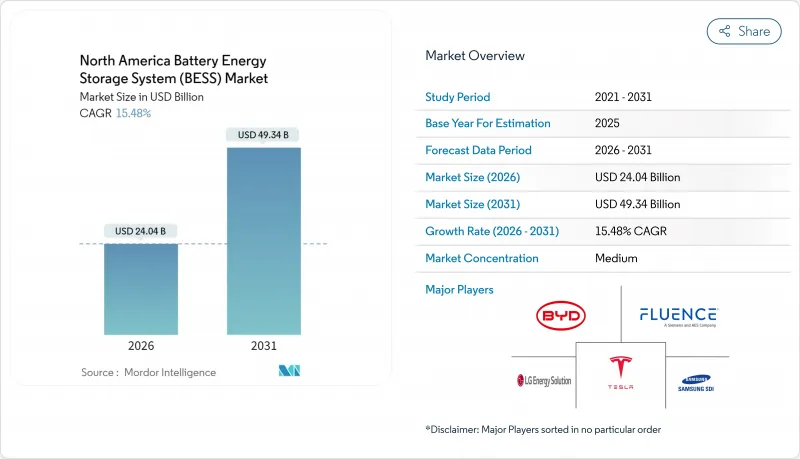
North America Battery Energy Storage System (BESS) - Market Share Analysis, Industry Trends & Statistics, Growth Forecasts (2026 - 2031)
The North America Battery Energy Storage System Market was valued at USD 20.82 billion in 2025 and estimated to grow from USD 24.04 billion in 2026 to reach USD 49.34 billion by 2031, at a CAGR of 15.48% during the forecast period (2026-2031).
Federal tax credits, domestic cell manufacturing, and fast-rising grid-scale demand from renewable energy integration, data center build-outs, and transmission congestion underpin this growth. Utility procurement accelerated after the Inflation Reduction Act extended the 30% investment tax credit to stand-alone storage, improving project internal rates of return and unlocking merchant-market development. Meanwhile, Michigan, Georgia, and Arizona gigafactories are reducing the landed costs of lithium-iron-phosphate (LFP) by 20%-30%, thereby narrowing the cost gap with gas peakers and shortening lead times. Developers now pursue multi-hour assets that stack revenues from frequency regulation, capacity payments, and energy arbitrage even as wholesale spreads remain volatile. Competitive intensity is rising as vertically integrated leaders, such as Tesla, Fluence, and LG Energy Solution, vie with pure-play integrators and utilities that self-develop projects. Meanwhile, long-duration alternatives, including vanadium flow and iron-air batteries, challenge lithium-ion incumbency for 8-to-12-hour and seasonal duty cycles.
North America Battery Energy Storage System (BESS) Market Trends and Insights
Surging State-Level Renewable Mandates
California's SB 100 targets 100% clean electricity by 2045 and sets an 11.5 GW storage procurement that utilities exceeded by mid-2024, ensuring a robust multi-year development queue. New York mandates 6 GW by 2030 with incentives that bridge merchant-revenue gaps, while ERCOT registered 5 GW of 2024 interconnection requests as scarcity pricing and coal retirements drove storage economics. Clear procurement targets de-risk capital, attract institutional investors, and align project designs with IEEE 2030.2 interoperability standards, thereby enhancing overall project efficiency. Mandates also signal long-term market visibility, enabling manufacturers to localize supply chains and lenders to structure back-levered debt. As more states shift from renewables-only targets to clean-energy standards that explicitly include storage, the baseline demand for utility-scale systems expands significantly.
Falling LFP Battery Costs from NA Gigafactories
CATL, LG Energy Solution, and other suppliers have commissioned U.S. LFP cell lines subsidized by an advanced-manufacturing credit worth USD 35 per kWh for cells and USD 10 per kWh for modules. Domestic production compresses delivered utility-scale BESS costs by up to 30%, shrinks procurement lead times from 12-14 months to 6-8 months, and shields developers from 25% Section 301 tariffs on Chinese imports. Multi-year offtake deals with utilities lock in volume, while tariff-risk reduction stabilizes CAPEX assumptions for project finance. The localized supply base is also catalyzing component standardization and higher domestic content bonuses, which further improve financial returns.
High Up-Front CAPEX & Raw-Material Swings
Installed BESS costs remain 2.5-3X the capacity price of combined-cycle gas turbines, limiting uptake where carbon pricing is absent. Lithium carbonate prices plummeted from USD 80,000/t in early 2024 to USD 12,000/t by year-end, highlighting procurement volatility that complicates fixed-price EPC contracts. Cobalt and nickel supply is geographically concentrated, exposing NMC chemistries to geopolitical risk. A 2024 Section 232 probe into Chinese tariff circumvention threatens additional 15%-25% duties, further muddying cost forecasts. Merchant developers lacking long-term offtake struggle to pass through cost shocks, slowing final investment decisions, especially in ERCOT and CAISO, where revenue spreads fluctuate.
Other drivers and restraints analyzed in the detailed report include:
- IRA Stand-Alone Storage Tax Credit
- Grid-Hungry Data-Center Build-Out
- Local Fire-Safety Siting Moratoria
For complete list of drivers and restraints, kindly check the Table Of Contents.
Segment Analysis
Lithium-ion technologies maintained a 91.10% share of the battery energy storage system market in 2025, driven by mature LFP supply chains and declining cell prices. Flow batteries, although with a 5.35% share, are growing at a 30.43% annual rate as utilities seek 8- to 12-hour discharge assets that are immune to thermal runaway. A 100 MWh zinc-battery pilot in Texas achieved 10,000 cycles with minimal fade, highlighting the longevity gap compared to LFP. The battery energy storage system market size for flow technologies is poised to benefit from Pacific Northwest utility RFPs that favor non-lithium chemistries for seasonal firming. Sodium-ion trials for residential storage show promise in cold climates, while lead-acid continues to lose ground in utility applications due to the rapid decline in LFP costs.
Flow battery adoption indicates a growing recognition of cycle-life economics and the independent scaling of power versus energy. A 21 MWh vanadium project in Oregon, coupled with wind, provides multi-day firm capacity, avoiding the 300% oversizing required by four-hour lithium designs. Sodium-ion's lower raw-material exposure positions it for cost-sensitive residential markets, especially under California's NEM 3.0 tariffs. Shifting utility procurement specs toward long-duration performance will progressively erode lithium's dominance beyond the 4-hour niche.
On-grid systems captured 88.20% of 2025 deployments, supported by FERC Order 841 and robust participation in the wholesale market. However, off-grid and microgrid solutions are expanding at a 28.10% CAGR as mines, military bases, and islands displace expensive diesel. A 50 MWh Canadian mine microgrid reduced diesel use by 70%, saving USD 8 million annually and eliminating 25,000 t CO2. The U.S. Department of Defense earmarked USD 150 million in 2024 for islandable bases, while Alaska villages blend renewables and storage to reduce diesel costs by USD 0.40-0.60 kWh. Hybrid microgrids that retain grid ties but can island during wildfires or hurricanes are proliferating in California and Texas.
Off-grid economics center on avoided fuel and transmission costs, enabling rapid paybacks despite higher per-kWh CAPEX. A Caribbean resort's 10 MWh system eliminated a USD 2 million diesel bill with a six-year payback. Hybrid models also monetize demand-response payments while enhancing resilience. The updated IEEE 1547-2018 standards mandate seamless grid-to-island transitions, simplifying interconnection and fostering broader adoption among commercial and industrial (C&I) users.
The North America Battery Energy Storage System (BESS) Market Report is Segmented by Battery Type (Lithium-Ion, and More), Connection Type (On-Grid and Off-Grid), Component (Battery Pack and Racks, Energy Management Software, and More), Energy Capacity Range (10 To 100 MWh, Above 500 MWh, and More), End-User Application (Utility, Commercial and Industrial, and Residential), and Geography (United States, Canada, and Mexico).
List of Companies Covered in this Report:
- Tesla Inc.
- Fluence Energy Inc.
- LG Energy Solution Ltd.
- Samsung SDI Co. Ltd.
- BYD Company Ltd.
- Panasonic Holdings Corp.
- Saft (TotalEnergies)
- Contemporary Amperex Technology Ltd.
- AES Corporation
- GE Vernova
- ABB Ltd.
- Siemens Energy
- Schneider Electric SE
- Eos Energy Enterprises
- NEC Energy Solutions
- Enel North America
- NextEra Energy Resources
- Sunverge Energy
- Powin LLC
- Wartsila Corporation
Additional Benefits:
- The market estimate (ME) sheet in Excel format
- 3 months of analyst support
TABLE OF CONTENTS
1 Introduction
- 1.1 Study Assumptions & Market Definition
- 1.2 Scope of the Study
2 Research Methodology
3 Executive Summary
4 Market Landscape
- 4.1 Market Overview
- 4.2 Market Drivers
- 4.2.1 Surging state-level renewable mandates
- 4.2.2 Falling LFP battery costs from NA gigafactories
- 4.2.3 IRA stand-alone storage tax credit
- 4.2.4 Grid-hungry data-centre build-out
- 4.2.5 Merchant-market revenue-stack innovation
- 4.2.6 AI-optimised BESS asset management
- 4.3 Market Restraints
- 4.3.1 Pumped-hydro & LDES competition
- 4.3.2 High up-front CAPEX & raw-material swings
- 4.3.3 Local fire-safety siting moratoria
- 4.3.4 Tariff / trade-case cost shocks
- 4.4 Supply-Chain Analysis
- 4.5 Regulatory Landscape
- 4.6 Technological Outlook
- 4.7 Porter's Five Forces
- 4.7.1 Threat of New Entrants
- 4.7.2 Bargaining Power of Suppliers
- 4.7.3 Bargaining Power of Buyers
- 4.7.4 Threat of Substitutes
- 4.7.5 Competitive Rivalry
- 4.8 Investment Analysis
5 Market Size & Growth Forecasts
- 5.1 By Battery Type
- 5.1.1 Lithium-ion (Lithium Iron Phosphate (LFP), Nickel-Manganese-Cobalt (NMC), Lithium Titanate (LTO))
- 5.1.2 Lead-acid
- 5.1.3 Flow Battery (Vanadium Redox, Zinc-Bromine)
- 5.1.4 Sodium-ion
- 5.1.5 Other Battery Technologies (NiCd, Hybrid Super-capacitors)
- 5.2 By Connection Type
- 5.2.1 On-Grid (Utility Interconnected)
- 5.2.2 Off-Grid (Micro-Grid, Hybrid)
- 5.3 By Component
- 5.3.1 Battery Pack and Racks
- 5.3.2 Power Conversion System (PCS)
- 5.3.3 Energy Management Software (EMS)
- 5.3.4 Balance-of-Plant and Services
- 5.4 By Energy Capacity Range
- 5.4.1 Below 10 MWh
- 5.4.2 10 to 100 MWh
- 5.4.3 100 to 500 MWh
- 5.4.4 Above 500 MWh
- 5.5 By End-user Application
- 5.5.1 Utility
- 5.5.2 Commercial and Industrial
- 5.5.3 Residential
- 5.6 By Geography
- 5.6.1 United States
- 5.6.2 Canada
- 5.6.3 Mexico
6 Competitive Landscape
- 6.1 Market Concentration
- 6.2 Strategic Moves (M&A, Partnerships, PPAs)
- 6.3 Market Share Analysis (Market Rank/Share for key companies)
- 6.4 Company Profiles (includes Global level Overview, Market level overview, Core Segments, Financials as available, Strategic Information, Products & Services, and Recent Developments)
- 6.4.1 Tesla Inc.
- 6.4.2 Fluence Energy Inc.
- 6.4.3 LG Energy Solution Ltd.
- 6.4.4 Samsung SDI Co. Ltd.
- 6.4.5 BYD Company Ltd.
- 6.4.6 Panasonic Holdings Corp.
- 6.4.7 Saft (TotalEnergies)
- 6.4.8 Contemporary Amperex Technology Ltd.
- 6.4.9 AES Corporation
- 6.4.10 GE Vernova
- 6.4.11 ABB Ltd.
- 6.4.12 Siemens Energy
- 6.4.13 Schneider Electric SE
- 6.4.14 Eos Energy Enterprises
- 6.4.15 NEC Energy Solutions
- 6.4.16 Enel North America
- 6.4.17 NextEra Energy Resources
- 6.4.18 Sunverge Energy
- 6.4.19 Powin LLC
- 6.4.20 Wartsila Corporation
7 Market Opportunities & Future Outlook
- 7.1 White-space & Unmet-Need Assessment

