
PUBLISHER: Mordor Intelligence | PRODUCT CODE: 1910948

PUBLISHER: Mordor Intelligence | PRODUCT CODE: 1910948
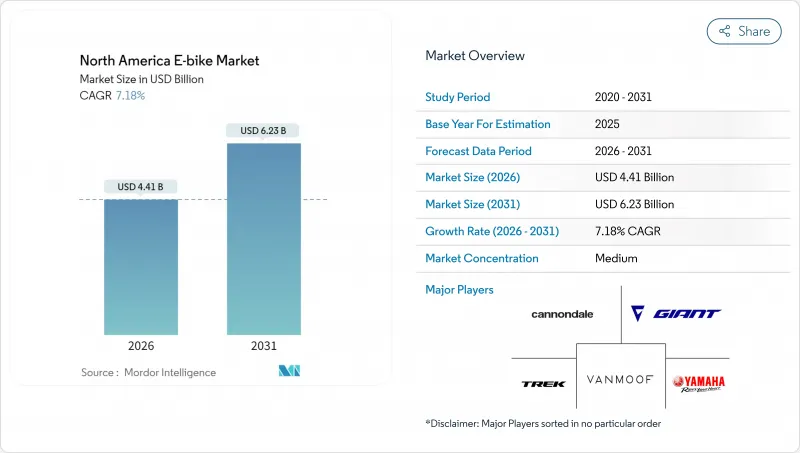
North America E-bike - Market Share Analysis, Industry Trends & Statistics, Growth Forecasts (2026 - 2031)
The North America E-bike market was valued at USD 4.11 billion in 2025 and estimated to grow from USD 4.41 billion in 2026 to reach USD 6.23 billion by 2031, at a CAGR of 7.18% during the forecast period (2026-2031).
The combination of federal purchase incentives, growing urban cycling infrastructure, and changing commuter preferences keeps demand on a steady upward trajectory. Rapid rollout of protected bike lanes and employer-sponsored micromobility programs is widening the addressable customer base beyond core recreational cyclists. Federal and state fiscal measures that lower upfront prices have already shortened payback periods relative to public transit passes.
North America E-bike Market Trends and Insights
Federal Tax Credits for Light Electric Vehicles
Federal tax credit expansion under the E-BIKE Act framework creates direct consumer incentives worth up to USD 1,500 per qualifying electric bicycle purchase, fundamentally altering price elasticity calculations for middle-income households. This policy mechanism mirrors successful electric vehicle adoption strategies, where upfront cost reduction accelerates market penetration beyond early adopter segments. The credit structure particularly benefits pedal-assisted models under 750W, aligning with existing federal motor vehicle definitions while avoiding regulatory complexity associated with higher-powered variants. Implementation timing coincides with state-level incentive programs in California, Colorado, and Vermont, creating cumulative savings that position e-bikes competitively against public transportation monthly passes.
Rising Corporate Micromobility Fleets
Corporate fleet adoption accelerates as companies recognize e-bikes as solutions for employee commuting, campus transportation, and last-mile delivery operations, with deployment costs significantly lower than traditional vehicle fleets. Major corporations, including Amazon, UPS, and DHL, expanded e-cargo bike programs throughout 2024, driven by urban delivery restrictions and carbon neutrality commitments. Fleet operators report 40-60% cost reductions compared to van-based delivery systems in dense urban environments, while achieving superior delivery times during peak traffic periods. This corporate adoption creates bulk purchasing dynamics that influence manufacturer production planning and technology development priorities, particularly for commercial-grade components and fleet management software integration.
Tightening Lithium-Ion Cell Supply in NAFTA Region
Lithium-ion cell supply constraints within NAFTA territories create cost pressures and delivery delays that disproportionately impact e-bike manufacturers without established Asian supply relationships. Trade policy shifts toward regional content requirements conflict with current battery cell production capacity, as North American facilities primarily serve automotive applications with limited availability for micromobility segments. This supply-demand imbalance forces manufacturers to choose between higher-cost regional sourcing and potential tariff exposure on imported cells, creating margin compression that may limit product portfolio expansion. Cell shortage particularly affects mid-range price segments where cost optimization remains critical for mass market adoption, while premium manufacturers maintain flexibility through diversified sourcing strategies.
Other drivers and restraints analyzed in the detailed report include:
- Integration of Connected Telematics and OTA Updates
- Expansion of Class 3 (28 mph) E-Bike Regulations
- Insurance Premium Hikes for Commercial E-Cargo Fleets
For complete list of drivers and restraints, kindly check the Table Of Contents.
Segment Analysis
Pedal-assisted systems maintain a 78.98% market share in 2025, reflecting consumer preference for natural cycling experiences enhanced by motor assistance rather than replaced by it. Speed pedelecs emerge as the fastest-growing segment at 17.54% CAGR through 2031, driven by expanding Class 3 regulations and suburban commuter adoption seeking car-replacement solutions. Throttle-assisted variants occupy a specialized niche, primarily serving accessibility applications and commercial delivery scenarios where instant power delivery provides operational advantages. The propulsion type evolution reflects broader transportation electrification trends, where user control and energy efficiency considerations favor pedal-integrated systems over purely throttle-based alternatives.
Regulatory frameworks increasingly distinguish between propulsion types, with pedal-assisted models receiving preferential treatment in bike lane access and parking regulations across North American jurisdictions. Speed pedelec growth correlates with infrastructure improvements on dedicated cycling corridors, where higher speeds become practical and safe for longer-distance commuting applications.
City/urban applications dominate with 81.10% market share in 2025, yet cargo/utility variants accelerate at 20.98% CAGR as e-commerce delivery economics reshape last-mile logistics calculations. Urban models benefit from established cycling infrastructure and consumer familiarity, while cargo configurations unlock new use cases previously dominated by motorized vehicles. Trekking/mountain segments serve recreational markets with specialized terrain capabilities, though growth remains constrained by seasonal usage patterns and niche consumer bases. This application segmentation reflects transportation mode substitution rather than simple cycling market expansion, indicating fundamental shifts in urban mobility preferences.
Commercial cargo adoption particularly accelerates in dense urban environments where parking restrictions and congestion charges create cost advantages for e-bike delivery systems. Trekking applications gain traction through rail-trail tourism development and outdoor recreation infrastructure investments, though seasonal demand patterns limit year-round growth potential.
Lithium-ion batteries command 92.10% market share in 2025 while maintaining 15.98% CAGR through 2031, reflecting technology maturation and supply chain optimization that eliminates alternative chemistry considerations for most applications. Lead-acid alternatives persist in price-sensitive segments, though declining cost differentials and performance advantages favor lithium-ion adoption across all market tiers. Battery chemistry standardization enables component interoperability and service network development, creating ecosystem effects that reinforce lithium-ion dominance despite supply chain vulnerabilities.
Energy density improvements and charging speed enhancements drive continued lithium-ion investment, with manufacturers focusing on cell chemistry optimization rather than alternative technologies. Battery management system integration becomes increasingly sophisticated, enabling predictive maintenance and performance optimization that extends operational lifecycles while reducing total cost of ownership.
The North America E-Bike Market Report is Segmented by Propulsion Type (Pedal Assisted, and More), Application Type (Cargo/Utility, and More), Battery Type (Li-Ion, and More), Motor Placement (Hub Front/Rear, Mid-Drive), Drive Systems (Chain Drive, Belt Drive), Motor Power (Less Than 250 W, and More), Price Band, Sales Channel, End Use and by Country. The Market Forecasts are Provided in Terms of Value (USD) and Volume (Units).
List of Companies Covered in this Report:
- Trek Bicycle Corporation
- Giant Manufacturing Co.
- Rad Power Bikes
- Specialized Bicycle Components
- Cycling Sports Group, Inc. (Cannondale)
- Ride Aventon Inc.
- Yamaha Bicycles
- Bosch eBike Systems
- Shimano Inc.
- Riese and Muller
- VanMoof
- Propella Electric Bikes
- QuietKat (Vista Outdoor)
- Lectric eBikes
- Stromer
- Pedego Electric Bikes
- Bulls Bike USA
- Juiced Bikes
- Velotric
- Magnum Bikes
Additional Benefits:
- The market estimate (ME) sheet in Excel format
- 3 months of analyst support
TABLE OF CONTENTS
1 Introduction
- 1.1 Study Assumptions and Market Definition
- 1.2 Scope of the Study
2 Research Methodology
3 Executive Summary
4 Key Industry Trends
- 4.1 Annual Bicycle Sales
- 4.2 Average Selling Price and Price-Band Mix
- 4.3 Cross-Border Trade in E-Bikes and Parts (Imports/Exports)
- 4.4 E-Bike Share of Total Bicycle Sales
- 4.5 Commuters with 5 to 15 km One-Way Trips (%)
- 4.6 Bicycle/E-Bike Rental Market Size
- 4.7 E-Bike Battery Pack Price
- 4.8 Battery Chemistry Price Comparison
- 4.9 Last-Mile (Hyper-Local) Delivery Volume
- 4.10 Protected Bicycle Lanes (km)
- 4.11 Trekking/Outdoor Activity Participation
- 4.12 E-Bike Battery Capacity (Wh)
- 4.13 Urban Traffic Congestion Index
- 4.14 Regulatory Framework
- 4.14.1 Homologation and Certification of E-Bicycles
- 4.14.2 Export-Import and Trade Regulation
- 4.14.3 Classification, Road Access and User Rules
- 4.14.4 Battery, Charger and Charging Safety
5 Market Landscape
- 5.1 Market Overview
- 5.2 Market Drivers
- 5.2.1 Federal Tax Credits for Light Electric Vehicles
- 5.2.2 Rising Corporate Micromobility Fleets
- 5.2.3 Integration of Connected Telematics and OTA Updates
- 5.2.4 Expansion of Class 3 (28 mph) E-Bike Regulations
- 5.2.5 Growth of Rail-Trail Tourism Corridors
- 5.2.6 Battery-as-a-Service Subscription Models
- 5.3 Market Restraints
- 5.3.1 Tightening Lithium-Ion Cell Supply in NAFTA Region
- 5.3.2 Insurance Premium Hikes for Commercial E-Cargo Fleets
- 5.3.3 Municipal Speed-Limit Caps below 20 mph
- 5.3.4 Persistent Perception of Fire-Hazard Risk
- 5.4 Value/Supply-Chain Analysis
- 5.5 Technological Outlook
- 5.6 Porter's Five Forces
- 5.6.1 Threat of New Entrants
- 5.6.2 Bargaining Power of Suppliers
- 5.6.3 Bargaining Power of Buyers
- 5.6.4 Threat of Substitutes
- 5.6.5 Competitive Rivalry
6 Market Size and Growth Forecasts (Value (USD) and Volume (Units))
- 6.1 By Propulsion Type
- 6.1.1 Pedal Assisted
- 6.1.2 Speed Pedelec
- 6.1.3 Throttle Assisted
- 6.2 By Application Type
- 6.2.1 Cargo/Utility
- 6.2.2 City/Urban
- 6.2.3 Trekking/Mountain
- 6.3 By Battery Type
- 6.3.1 Lead Acid Battery
- 6.3.2 Lithium-ion Battery
- 6.3.3 Others
- 6.4 By Motor Placement
- 6.4.1 Hub (front/rear)
- 6.4.2 Mid-drive
- 6.5 By Drive Systems
- 6.5.1 Chain Drive
- 6.5.2 Belt Drive
- 6.6 By Motor Power
- 6.6.1 Less than 250 W
- 6.6.2 251 to 350 W
- 6.6.3 351 to 500 W
- 6.6.4 501 to 600 W
- 6.6.5 More than 600 W
- 6.7 By Price Band (USD)
- 6.7.1 Up to 1,000
- 6.7.2 1,000 to 1,499
- 6.7.3 1,500 to 2,499
- 6.7.4 2,500 to 3,499
- 6.7.5 3,500 to 5,999
- 6.7.6 Above 6,000
- 6.8 By Sales Channel
- 6.8.1 Online
- 6.8.2 Offline
- 6.9 By End Use
- 6.9.1 Commercial Delivery
- 6.9.1.1 Retail and Goods Delivery
- 6.9.1.2 Food and Beverage Delivery
- 6.9.2 Service Providers
- 6.9.3 Personal and Family Use
- 6.9.4 Institutional
- 6.9.5 Others
- 6.9.1 Commercial Delivery
- 6.10 By Country
- 6.10.1 United States
- 6.10.2 Canada
- 6.10.3 Mexico
7 Competitive Landscape
- 7.1 Market Concentration
- 7.2 Strategic Moves
- 7.3 Market Share Analysis
- 7.4 Company Profiles (Includes Global level Overview, Market level overview, Core Segments, Financials as available, Strategic Information, Market Rank/Share for key companies, Products and Services, and Recent Developments)
- 7.4.1 Trek Bicycle Corporation
- 7.4.2 Giant Manufacturing Co.
- 7.4.3 Rad Power Bikes
- 7.4.4 Specialized Bicycle Components
- 7.4.5 Cycling Sports Group, Inc. (Cannondale)
- 7.4.6 Ride Aventon Inc.
- 7.4.7 Yamaha Bicycles
- 7.4.8 Bosch eBike Systems
- 7.4.9 Shimano Inc.
- 7.4.10 Riese and Muller
- 7.4.11 VanMoof
- 7.4.12 Propella Electric Bikes
- 7.4.13 QuietKat (Vista Outdoor)
- 7.4.14 Lectric eBikes
- 7.4.15 Stromer
- 7.4.16 Pedego Electric Bikes
- 7.4.17 Bulls Bike USA
- 7.4.18 Juiced Bikes
- 7.4.19 Velotric
- 7.4.20 Magnum Bikes
8 Market Opportunities and Future Outlook
- 8.1 White-Space and Unmet-Need Assessment
9 Key Strategic Questions for E-Bike CEOs

