
PUBLISHER: Mordor Intelligence | PRODUCT CODE: 1911744

PUBLISHER: Mordor Intelligence | PRODUCT CODE: 1911744
E-Bike - Market Share Analysis, Industry Trends & Statistics, Growth Forecasts (2026 - 2031)
e-bike market size in 2026 is estimated at USD 39.42 billion, growing from 2025 value of USD 38.08 billion with 2031 projections showing USD 46.86 billion, growing at 3.52% CAGR over 2026-2031.
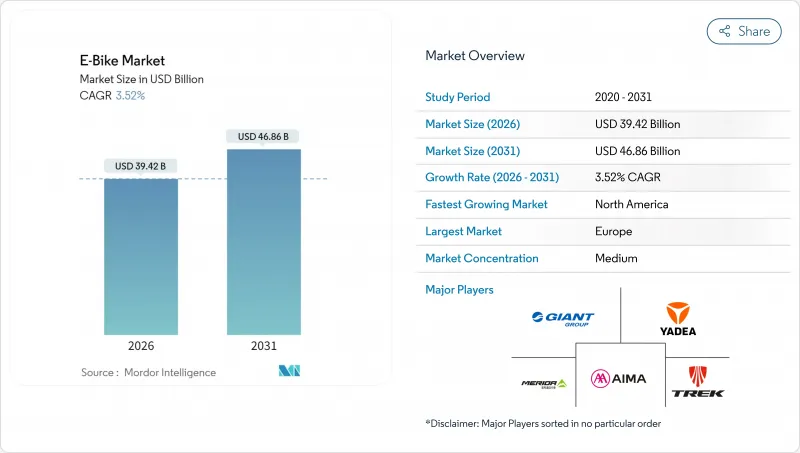
The measured expansion reflects the transition from early adoption to mainstream use as corporate leasing schemes now give employees access to salary-sacrifice bikes. Demand is tilting toward premium models priced USD 3,500-5,999, the fastest-growing band, while targeted subsidies-France's EUR 4,000 (~USD 4,622) incentive and Poland's PLN 300 million (~USD 81 million) program-continue to widen the addressable base. Battery technology remains a cornerstone; lithium-ion captures a major share, yet sodium-ion and solid-state chemistries are lining up to ease China-centric raw-material risk.
Global E-Bike Market Trends and Insights
Urban Congestion Driving Micro-Mobility
Parking spaces in tier-1 cities cost as high as USD 30,000, making e-bikes a cost-efficient commute tool over 5-15 km trips-the distance that accounts for 40% of urban journeys. London's ULEZ expansion, plus GBP 7,000 (~USD 9,319) scrappage grants, has accelerated uptake among couriers, while companies such as Amazon and Google subsidize monthly e-bike subscriptions to ease parking stress and hit sustainability targets .
Li-ion Battery Energy-Density and Cost Declines
Lithium-ion pack prices have declined significantly since 2010, moving 100+ km range bikes under the USD 2,000 mark. Fast-charge designs now reach 80% in 30 minutes, opening doors for high-utilization commercial fleets. Sodium-ion prototypes promise similar cycle life at 30% reduced cost, while solid-state roadmaps target 2X energy density by 2028.
Battery-Fire Incidents and Stricter Safety Norms
NYC recorded 187 e-mobility fires in 2023, lifting four-year costs to USD 518.6 million. California's SB 1271 and the UL 2849 standard now require certified packs, adding USD 200-500 per unit. Manufacturers are investing in thermal management and remote diagnostics to keep pace.
Other drivers and restraints analyzed in the detailed report include:
- Government Incentives and Purchase Subsidies
- Corporate Employee E-Bike Benefit Programs
- High Upfront Cost vs. Conventional Bikes
For complete list of drivers and restraints, kindly check the Table Of Contents.
Segment Analysis
The market size for pedal-assist models reached a commanding 78.90% share in 2025, benefiting from favorable EU regulations that classify them as bicycles. Speed-pedelec variants, offering assistance up to 45 km/h, are charting a 4.02% CAGR as commuters seek car-like travel times in dense cities.
Manufacturers are layering AI algorithms onto motor controllers to optimize output by terrain and rider habits. Shimano's forthcoming automatic-shift drivetrain illustrates how suppliers bundle smart gearboxes with high-torque motors, strengthening their appeal among urban professionals.
City/urban bikes generated 76.05% of the market share in 2025 as urban riders opted for sweat-free commuting. Trekking/mountain models, however, are advancing at 3.65% CAGR, spurred by tour operators that now default to e-assisted fleets.
Operators see expanded demographics, older cyclists and mixed-fitness groups, as key growth levers. As trail access rules evolve, the segment is poised for further penetration into national parks and resort destinations.
Lithium-ion cells controlled 98.41% of the e-bike market share in 2025, underlining cost leadership and energy density. The "Others" bucket, housing sodium-ion and early solid-state prototypes, is growing at 4.32% CAGR as brands hedge raw-material exposure.
OEMs are dual-sourcing prismatic and cylindrical formats to mitigate China-centric processing. Should sodium-ion hit expected price parity by 2027, the chemistry could siphon double-digit share from legacy packs.
The Global E-Bike Market Report is Segmented by Propulsion Type (Pedal Assisted, Speed Pedelec, and More), Application Type (Cargo/Utility, City/Urban, and More), Battery Type (Lead Acid Battery, Lithium-Ion Battery, and More), Motor Placement (Hub (Front/Rear), Mid-Drive), Drive Systems, Motor Power, Price Band, Sales Channel, End Use, and Geography. The Market Forecasts are Provided in Terms of Value (USD) and Volume (Units).
Geography Analysis
Europe retained 54.80% of the 2025 e-bike market revenue. Germany alone has 15.7 million units in circulation and sold 2.1 million in 2024, helped by salary-sacrifice programs covering several workers . The Netherlands shows saturation traits, with e-bikes normalized across age groups, while France's EUR 4,000 (~USD 4,622) low-income grant keeps funneling new buyers. Continuous path networks and bicycle-first urban planning remain Europe's durable competitive edge.
North America, though smaller today, is the quickest-growing region at 7.19% CAGR. State rebates of up to USD 1,750 in California and New York, alongside corporate stipends, are unlocking latent demand. Canada's CAD 400 million (~USD 286 million) infrastructure rollout links e-bike lanes to charging nodes, creating end-to-end fleets for commuters and delivery riders alike.
Asia-Pacific reflects a tapestry of conditions. China supplies a major share of e-bike imports in the United States and posted notable export receipts in 2024. India crossed a significant electric two-wheeler mark in 2024, though mopeds still outweigh pedal-assist formats. Japan and South Korea cater to premium, tech-heavy niches, while Australia leans on eco-tourism routes to lift trekking sales. Localized regulation and income profiles dictate tailored channel, price, and specification strategies.
- Aima Technology Group Co., Ltd.
- Canyon Bicycles GmbH
- Fritzmeier Systems GmbH & Co. KG (M1 Sporttechnik)
- Giant Manufacturing Co., Ltd.
- Jiangsu Xinri E-Vehicle Co., Ltd.
- Luyuan Electric Vehicle Co., Ltd.
- Merida Industry Co., Ltd.
- Myvelo Co., Ltd.
- Rad Power Bikes Inc.
- Riese & Muller GmbH
- Pon Holdings B.V.
- Samchuly Bicycle
- Specialized Bicycle Components, Inc.
- Dongguan Tailing Electric Vehicle Co., Ltd
- Tianjin Fuji-Ta Bicycle Co., Ltd.
- Trek Bicycle Corporation
- VanMoof BV
- Yadea Group Holdings Ltd.
- Yamaha Motor Co., Ltd.
Additional Benefits:
- The market estimate (ME) sheet in Excel format
- 3 months of analyst support
TABLE OF CONTENTS
1 Introduction
- 1.1 Study Assumptions & Market Definition
- 1.2 Scope of the Study
2 Research Methodology
3 Executive Summary
4 Key Industry Trends
- 4.1 Annual Bicycle Sales
- 4.2 Average Selling Price & Price-Band Mix
- 4.3 Cross-Border Trade in E-Bikes & Parts (Imports/Exports)
- 4.4 E-Bike Share of Total Bicycle Sales
- 4.5 Commuters with 5-15 km One-Way Trips (%)
- 4.6 Bicycle/E-Bike Rental Market Size
- 4.7 E-Bike Battery Pack Price
- 4.8 Battery Chemistry Price Comparison
- 4.9 Last-Mile (Hyper-Local) Delivery Volume
- 4.10 Protected Bicycle Lanes (km)
- 4.11 Trekking/Outdoor Activity Participation
- 4.12 E-Bike Battery Capacity (Wh)
- 4.13 Urban Traffic Congestion Index
- 4.14 Regulatory Framework
- 4.14.1 Homologation and Certification of E-Bicycles
- 4.14.2 Export-Import and Trade Regulation
- 4.14.3 Classification, Road Access and User Rules
- 4.14.4 Battery, Charger and Charging Safety
5 Market Landscape
- 5.1 Market Overview
- 5.2 Market Drivers
- 5.2.1 Urban Congestion Driving Micro-Mobility
- 5.2.2 Li-ion Battery Energy-Density and Cost Declines
- 5.2.3 Government Incentives and Purchase Subsidies
- 5.2.4 Corporate Employee E-Bike Benefit Programs
- 5.2.5 Insurance Discounts for Cargo E-Bikes
- 5.2.6 Growth of E-Bike Tourism Routes
- 5.3 Market Restraints
- 5.3.1 Battery-Fire Incidents and Stricter Safety Norms
- 5.3.2 High Upfront Cost vs. Conventional Bikes
- 5.3.3 Limited Charging Infra in Developing Regions
- 5.3.4 Critical-Mineral Supply Volatility
- 5.4 Value / Supply-Chain Analysis
- 5.5 Regulatory Landscape
- 5.6 Technological Outlook
- 5.7 Porter's Five Forces
- 5.7.1 Threat of New Entrants
- 5.7.2 Bargaining Power of Suppliers
- 5.7.3 Bargaining Power of Buyers
- 5.7.4 Threat of Substitutes
- 5.7.5 Competitive Rivalry
6 Market Size & Growth Forecasts (Value (USD) and Volume (Units))
- 6.1 By Propulsion Type
- 6.1.1 Pedal Assisted
- 6.1.2 Speed Pedelec
- 6.1.3 Throttle Assisted
- 6.2 By Application Type
- 6.2.1 Cargo/Utility
- 6.2.2 City/Urban
- 6.2.3 Trekking/Mountain
- 6.3 By Battery Type
- 6.3.1 Lead Acid Battery
- 6.3.2 Lithium-ion Battery
- 6.3.3 Others
- 6.4 By Motor Placement
- 6.4.1 Hub (Front/Rear)
- 6.4.2 Mid-Drive
- 6.5 By Drive Systems
- 6.5.1 Chain Drive
- 6.5.2 Belt Drive
- 6.6 By Motor Power
- 6.6.1 Below 250 W
- 6.6.2 251-350 W
- 6.6.3 351-500 W
- 6.6.4 501-600 W
- 6.6.5 Above 600 W
- 6.7 By Price Band
- 6.7.1 Up to USD 1,000
- 6.7.2 USD 1,000-1,499
- 6.7.3 USD 1,500-2,499
- 6.7.4 USD 2,500-3,499
- 6.7.5 USD 3,500-5,999
- 6.7.6 Above USD 6,000
- 6.8 By Sales Channel
- 6.8.1 Online
- 6.8.2 Offline
- 6.9 By End Use
- 6.9.1 Commercial Delivery
- 6.9.1.1 Retail and Goods Delivery
- 6.9.1.2 Food and Beverage Delivery
- 6.9.2 Service Providers
- 6.9.3 Personal and Family Use
- 6.9.4 Institutional
- 6.9.5 Others
- 6.9.1 Commercial Delivery
- 6.10 By Geography
- 6.10.1 North America
- 6.10.1.1 United States
- 6.10.1.2 Canada
- 6.10.1.3 Rest of North America
- 6.10.2 South America
- 6.10.2.1 Argentina
- 6.10.2.2 Brazil
- 6.10.2.3 Rest of South America
- 6.10.3 Europe
- 6.10.3.1 Germany
- 6.10.3.2 United Kingdom
- 6.10.3.3 France
- 6.10.3.4 Italy
- 6.10.3.5 Spain
- 6.10.3.6 Netherlands
- 6.10.3.7 Austria
- 6.10.3.8 Sweden
- 6.10.3.9 Switzerland
- 6.10.3.10 Rest of Europe
- 6.10.4 Asia-Pacific
- 6.10.4.1 China
- 6.10.4.2 India
- 6.10.4.3 Japan
- 6.10.4.4 South Korea
- 6.10.4.5 Australia
- 6.10.4.6 New Zealand
- 6.10.4.7 Rest of Asia-Pacific
- 6.10.5 Middle East and Africa
- 6.10.5.1 Saudi Arabia
- 6.10.5.2 United Arab Emirates
- 6.10.5.3 South Africa
- 6.10.5.4 Rest of the Middle East and Africa
- 6.10.1 North America
7 Competitive Landscape
- 7.1 Market Concentration
- 7.2 Strategic Moves
- 7.3 Market Share Analysis
- 7.4 Company Profiles (Includes Global Level Overview, Market Level Overview, Core Segments, Financials as Available, Strategic Information, Market Rank/Share for Key Companies, Products and Services, SWOT Analysis, and Recent Developments)
- 7.4.1 Aima Technology Group Co., Ltd.
- 7.4.2 Canyon Bicycles GmbH
- 7.4.3 Fritzmeier Systems GmbH & Co. KG (M1 Sporttechnik)
- 7.4.4 Giant Manufacturing Co., Ltd.
- 7.4.5 Jiangsu Xinri E-Vehicle Co., Ltd.
- 7.4.6 Luyuan Electric Vehicle Co., Ltd.
- 7.4.7 Merida Industry Co., Ltd.
- 7.4.8 Myvelo Co., Ltd.
- 7.4.9 Rad Power Bikes Inc.
- 7.4.10 Riese & Muller GmbH
- 7.4.11 Pon Holdings B.V.
- 7.4.12 Samchuly Bicycle
- 7.4.13 Specialized Bicycle Components, Inc.
- 7.4.14 Dongguan Tailing Electric Vehicle Co., Ltd
- 7.4.15 Tianjin Fuji-Ta Bicycle Co., Ltd.
- 7.4.16 Trek Bicycle Corporation
- 7.4.17 VanMoof BV
- 7.4.18 Yadea Group Holdings Ltd.
- 7.4.19 Yamaha Motor Co., Ltd.
8 Market Opportunities & Future Outlook
9 Key Strategic Questions for E-Bikes CEOs

