
PUBLISHER: Mordor Intelligence | PRODUCT CODE: 1911316

PUBLISHER: Mordor Intelligence | PRODUCT CODE: 1911316
Europe Van - Market Share Analysis, Industry Trends & Statistics, Growth Forecasts (2026 - 2031)
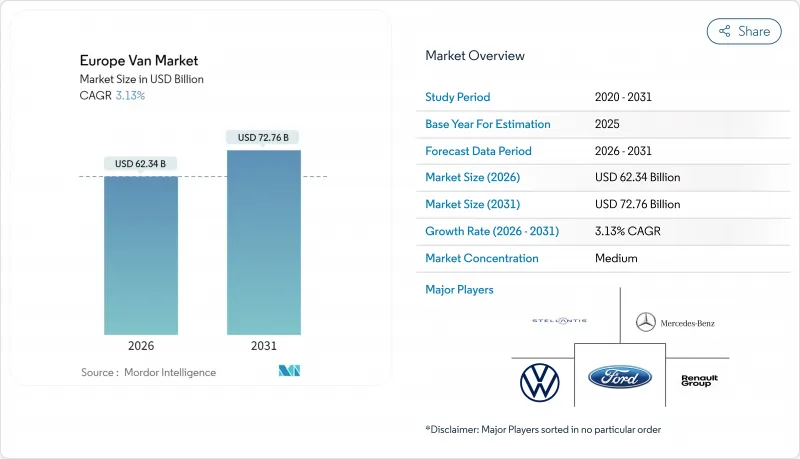
The European van market market size in 2026 is estimated at USD 62.34 billion, growing from 2025 value of USD 60.45 billion with 2031 projections showing USD 72.76 billion, growing at 3.13% CAGR over 2026-2031.
Momentum stems from tightening EU emission limits, the boom in e-commerce logistics, and fast-falling battery prices, while diesel powertrains still underpin long-haul capacity. Market leadership continues to rest with German fleets that have the scale to combine large procurement orders and in-house charging investments. At the same time, platform strategies from Stellantis and Mercedes-Benz, along with price-focused entrants BYD and SAIC Maxus, are redefining competitive dynamics as integrated charging, software, and financing services become part of every deal. Although semiconductor bottlenecks and depot fast-charging gaps curb near-term output, the convergence of total cost of ownership (TCO) parity and alternative-fuels rules indicates the European van market is approaching an irreversible switch toward electrified fleets.
Europe Van Market Trends and Insights
Rise in Sales of Electric Vans
Electric-van purchases are moving from policy compliance to cost-driven decisions as the total cost of ownership now beats diesel in 21 of 27 EU markets. DHL's 2,400-unit Ford E-Transit deal shows how bulk orders and salary-sacrifice programs accelerate scale, while B-permit extensions up to 4.25 t erase licensing limits. Projections indicate price parity for light commercial BEVs by 2026, locking in long-term demand. Fleet managers also value silent operation and instant torque that improve urban productivity, reinforcing momentum even where charging networks remain incomplete.
E-commerce Last-Mile Boom
Rapid e-commerce growth drives higher van density and shorter delivery routes, making quiet, zero-emission BEVs ideal for city nodes. Barcelona's micro-hub program trimmed van miles 30%, favoring compact BEVs with instant torque and low noise that face no urban access bans . Dark stores and subscription delivery models spread demand beyond seasonal peaks, ensuring year-round utilization. Route-optimization software integrates with traffic systems, boosting drop rates while lowering energy use. These operational gains combine with unrestricted urban access to make electric vans the preferred workhorse for last-mile fleets across Western Europe.
High Battery and Vehicle CAPEX
Up-front prices for electric vans remain 40-60% above diesel, while depot chargers can push investment above EUR 1 million (~USD 1.17 million) for large sites, straining the cash flow of small haulers despite lower running costs . Financing hurdles grow as leasing firms lack residual-value data, lengthening payback periods beyond typical budget cycles. Rising interest rates add to capital pressure, and public subsidies vary widely by country, creating planning uncertainty. These cost barriers slow adoption among regional operators and SMEs, who often defer electrification until second-hand BEV supply improves or turnkey Truck-as-a-Service packages absorb initial outlays.
Other drivers and restraints analyzed in the detailed report include:
- EU Low-Emission-Zone Mandates
- Urban Micro-fulfilment Hub Adoption
- Semiconductor Supply Constraints
For complete list of drivers and restraints, kindly check the Table Of Contents.
Segment Analysis
N1 Class I vans claimed 48.76% of the European van market share in 2025 and will expand at a 3.52% CAGR through 2031, reflecting how B-permit extensions up to 4.25 t remove driver-license barriers for zero-emission vehicles. Their compact footprints suit low-emission zones, narrow loading bays, and quick curbside drop-offs, while real-world battery ranges of 250-300 km now cover full urban duty cycles without mid-shift charging.
Class II and III models remain indispensable for refrigerated food, construction tools, and regional parcel runs but await denser chargers and 400 km batteries such as Ford's 89 kWh E-Transit update. Fleet managers compare kilograms delivered per kilowatt-hour payload efficiency to ensure that added battery mass never dilutes productivity. As next-generation lithium-iron-phosphate packs cut weight and cost, heavier classes are positioned to join the early adoption curve, reinforcing the light-duty segment's role as an electrification beachhead.
Vans above 5 m3 dominated the European van market, with 62.78% of the share in 2025, powered by wholesale distributors that maximize revenue kilometers via higher cube utilization. OEMs serve this core with modular platforms such as the Renault Master's 11-22 m3 configurations, which blend tall roofs, multiple wheelbases, and two-tonne payload ceilings.
Yet, less than/equal to 5 m3 models are rising at a 4.67% CAGR, underpinned by grocery quick-commerce and pharmacy delivery firms that prize alley maneuverability, easy parking, and lower battery capacities that keep sticker prices in check. Compact BEVs reach total cost-of-ownership breakeven faster because sub-50 kWh packs trim purchase costs and charge times. The bifurcation pushes OEMs toward dual roadmaps: high-cube variants optimized for palletized freight and smaller, software-enabled micro-vans engineered for dense urban loops where idle time and access fees erode diesel economics.
The Europe Van Market Report is Segmented by Gross Vehicle Weight (N1 Class I, N1 Class II, and N1 Class III), Cargo Space (Less Than/Equals 5 M3 and Above 5 M3), End User (Commercial Fleets, Government and Municipal, and More), Drive Type (IC Engine - Petrol, IC Engine - Diesel, and More), Sales Channel (Direct OEM Fleet Sales, and More), and Country. The Market Forecasts are Provided in Terms of Value (USD) and Volume (Units).
List of Companies Covered in this Report:
- Stellantis N.V.
- Mercedes-Benz Group AG
- Volkswagen AG
- Ford Motor Company
- Renault Group
- Iveco Group N.V.
- Toyota Motor Corporation
- Nissan Motor Co. Ltd
- BYD Co., Ltd.
- Hyundai Motor Company
- SAIC Maxus Automotive
- MAN Truck & Bus SE
- Opel Automobile GmbH
- London Electric Vehicle Company (LEVC)
- B-ON GmbH (StreetScooter GmbH)
- Rivian Automotive LLC
Additional Benefits:
- The market estimate (ME) sheet in Excel format
- 3 months of analyst support
TABLE OF CONTENTS
1 Introduction
- 1.1 Study Assumptions & Market Definition
- 1.2 Scope of the Study
2 Research Methodology
3 Executive Summary
4 Market Landscape
- 4.1 Market Overview
- 4.2 Market Drivers
- 4.2.1 Rise in Sales of Electric Vans
- 4.2.2 E-commerce Last-Mile Boom
- 4.2.3 EU Low-Emission-Zone Mandates
- 4.2.4 Urban Micro-fulfilment Hub Adoption
- 4.2.5 OEM Skateboard EV Platforms
- 4.2.6 Battery-as-a-Service Fleet Models
- 4.3 Market Restraints
- 4.3.1 High Battery and Vehicle CAPEX
- 4.3.2 Semiconductor Supply Constraints
- 4.3.3 Limited Depot Fast-Charging Sites
- 4.3.4 Driver Shortage and License Rules
- 4.4 Value / Supply-Chain Analysis
- 4.5 Regulatory Landscape
- 4.6 Technological Outlook
- 4.7 Porter's Five Forces
- 4.7.1 Threat of New Entrants
- 4.7.2 Bargaining Power of Buyers
- 4.7.3 Bargaining Power of Suppliers
- 4.7.4 Threat of Substitutes
- 4.7.5 Intensity of Competitive Rivalry
5 Market Size & Growth Forecasts (Value (USD) and Volume (Units))
- 5.1 By Gross Vehicle Weight
- 5.1.1 N1 Class I (Less than/Equals 2 t GVW)
- 5.1.2 N1 Class II (2-2.5 t GVW)
- 5.1.3 N1 Class III (2.5-3.5 t GVW)
- 5.2 By Cargo Space
- 5.2.1 Less than/Equals 5 m3
- 5.2.2 Above 5 m3
- 5.3 By End User
- 5.3.1 Commercial Fleets
- 5.3.2 Government and Municipal
- 5.3.3 Rental and Leasing Operators
- 5.4 By Drive Type
- 5.4.1 IC Engine - Petrol
- 5.4.2 IC Engine - Diesel
- 5.4.3 Battery Electric
- 5.4.4 Hybrid Electric
- 5.4.5 Fuel-Cell Electric
- 5.4.6 Alternative Fuel (CNG/LPG)
- 5.5 By Sales Channel
- 5.5.1 Direct OEM Fleet Sales
- 5.5.2 Authorised Dealerships
- 5.5.3 Online / Digital Platforms
- 5.6 By Country
- 5.6.1 Germany
- 5.6.2 United Kingdom
- 5.6.3 France
- 5.6.4 Italy
- 5.6.5 Spain
- 5.6.6 Netherlands
- 5.6.7 Sweden
- 5.6.8 Norway
- 5.6.9 Rest of Europe
6 Competitive Landscape
- 6.1 Market Concentration
- 6.2 Strategic Moves
- 6.3 Market Share Analysis
- 6.4 Company Profiles (Includes Global Level Overview, Market Level Overview, Core Segments, Financials as Available, Strategic Information, Market Rank/Share for Key Companies, Products and Services, SWOT Analysis, and Recent Developments)
- 6.4.1 Stellantis N.V.
- 6.4.2 Mercedes-Benz Group AG
- 6.4.3 Volkswagen AG
- 6.4.4 Ford Motor Company
- 6.4.5 Renault Group
- 6.4.6 Iveco Group N.V.
- 6.4.7 Toyota Motor Corporation
- 6.4.8 Nissan Motor Co. Ltd
- 6.4.9 BYD Co., Ltd.
- 6.4.10 Hyundai Motor Company
- 6.4.11 SAIC Maxus Automotive
- 6.4.12 MAN Truck & Bus SE
- 6.4.13 Opel Automobile GmbH
- 6.4.14 London Electric Vehicle Company (LEVC)
- 6.4.15 B-ON GmbH (StreetScooter GmbH)
- 6.4.16 Rivian Automotive LLC
7 Market Opportunities & Future Outlook
- 7.1 White-space & Unmet-Need Assessment

