
PUBLISHER: Mordor Intelligence | PRODUCT CODE: 1911343

PUBLISHER: Mordor Intelligence | PRODUCT CODE: 1911343
Indonesia Lubricants - Market Share Analysis, Industry Trends & Statistics, Growth Forecasts (2026 - 2031)
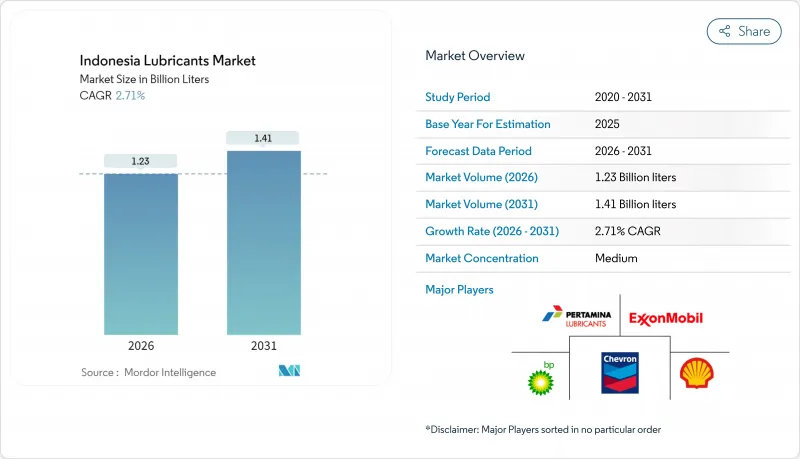
The Indonesian Lubricants Market was valued at 1.20 billion liters in 2025 and estimated to grow from 1.23 billion liters in 2026 to reach 1.41 billion liters by 2031, at a CAGR of 2.71% during the forecast period (2026-2031).
Demand continues to track Indonesia's steady industrial expansion, resolute infrastructure pipeline, and resilient vehicle parc, even as electric-mobility policies loom. Mineral-oil products still account for two-thirds of volume, yet the premium shift to synthetics accelerates because extended drain intervals appeal to fleet operators seeking lower lifetime operating costs. Capacity additions by multinationals-from Shell's new grease plant to ExxonMobil's on-site MACHINEXT service-underline how technology, localized production, and distribution reach shape competitive advantage. Meanwhile, mandatory SNI certification, B40 biodiesel adoption, and volatile crude prices intensify cost pressures, prompting portfolio upgrades toward anti-corrosion additives and bio-based blends. Supply-chain complexity across 17,000 islands creates logistical challenges, particularly for reaching high-value mining and industrial applications in outer regions.
Indonesia Lubricants Market Trends and Insights
Growing Automotive Parc Expansion
Indonesia's expanding automotive sector drives lubricant consumption through both passenger vehicle growth and commercial fleet modernization across the archipelago's logistics networks. According to the International Organization of Motor Vehicle Manufacturers (OICA), the country produced 1.19 million vehicles in 2024. The shift toward automatic transmission motorcycles creates demand for specialized lubricant formulations for matic applications. E-commerce expansion and the proliferation of last-mile delivery increase vehicle utilization rates, leading to a higher frequency of lubricant replacement beyond traditional consumer patterns. The government's push for electric vehicles and its planned phase-out of internal combustion engines by 2040 creates a structural ceiling for growth in automotive lubricant volumes. Regional distribution networks struggle to efficiently serve Indonesia's outer islands, creating supply bottlenecks that limit market penetration in emerging automotive clusters.
Rapid Industrial and Manufacturing Growth
Indonesia's manufacturing sector momentum directly translates to heightened industrial lubricant consumption across metalworking, power generation, and heavy equipment applications. The country's position as the world's largest nickel producer amplifies demand for specialized metalworking fluids and hydraulic systems lubricants in smelting operations. Manufacturing investment creates new industrial capacity requiring initial lubricant fills and ongoing maintenance programs. ExxonMobil's MACHINEXT on-site lubrication management technology, launched in June 2024, demonstrates how digital optimization reduces the total cost of ownership while extending equipment life cycles. The concentration of manufacturing on Java Island creates logistical advantages but limits growth potential in resource-rich outer regions where infrastructure development lags behind industrial investment.
Macroeconomic and Commodity-Price Volatility Dampening Cap-Utilization
Indonesia's lubricant industry faces capacity utilization challenges due to macroeconomic uncertainty and fluctuations in commodity prices, which dampen industrial activity and consumer spending patterns. The domestic industry operates at approximately 60% capacity utilization. Global supply chain disruptions and currency volatility impact base oil import costs, forcing manufacturers to adjust their pricing strategies and consider the effect on demand elasticity. Export-dependent sectors, such as palm oil and mining, experience cyclical downturns that reduce industrial lubricant consumption during commodity price slumps. The concentration of manufacturing capacity on Java island creates regional imbalances, while outer island operations struggle with supply chain reliability during economic turbulence. Regulatory compliance costs under mandatory SNI standards add operational overhead that smaller players cannot easily absorb during periods of margin compression.
Other drivers and restraints analyzed in the detailed report include:
- Nation-wide Infrastructure and Mining Activity Boom
- Marine and Fisheries Fleet Modernization
- Longer Drain-Interval Synthetic Formulations Lowering Volume/Vehicle
For complete list of drivers and restraints, kindly check the Table Of Contents.
Segment Analysis
Automotive engine oil commands 35.80% Indonesia's lubricant market share in 2025, reflecting Indonesia's vehicle-centric lubricant consumption patterns and the dominance of internal combustion engines across passenger and commercial segments. Hydraulic fluids represent the fastest-growing product category, with a 3.51% CAGR for 2026-2031, driven by infrastructure construction and the expansion of mining equipment, which require high-performance hydraulic systems. Industrial engine oil serves power generation and marine applications, while transmission fluids benefit from the automatic transmission boom in the motorcycle industry. Gear oils support Indonesia's heavy equipment and industrial machinery base, particularly in mining operations across Kalimantan and Sulawesi.
Process oils, including rubber process oil and white oil, serve the tire manufacturing and petrochemical industries in Indonesia, while metalworking fluids support the country's expanding manufacturing sector. Turbine oils and transformer oils cater to the power generation infrastructure, while greases serve a diverse range of applications, from automotive chassis lubrication to industrial bearing systems. The evolution of the product mix toward specialized formulations reflects Indonesia's increasing industrial sophistication and the growing influence of OEM specifications, which demand performance lubricants that meet international standards, such as API, JASO, and ACEA certifications.
The Indonesia Lubricants Market Report is Segmented by Product Type (Automotive Engine Oil, Industrial Engine Oil, Transmission Fluids, Gear Oil, Brake Fluids, Hydraulic Fluids, Greases, and More), End-User Industry (Automotive, Marine, Aerospace, Heavy Equipment, and Industrial), and Base Stock Type (Mineral Oil-Based, Synthetic, Semi-Synthetic, and Bio-Based). The Market Forecasts are Provided in Terms of Volume (Liters).
List of Companies Covered in this Report:
- BP Plc (Castrol)
- Chevron Corporation
- Exxon Mobil Corporation
- FUCHS
- Gulf Oil International Ltd
- Idemitsu Kosan Co., Ltd.
- PETRONAS Lubricants International
- PT Pertamina Lubricants
- PT Wiraswasta Gemilang Indonesia
- Shell plc
- The Lubrizol Corporation
- TOP 1 Oil Products Company
- TotalEnergies
Additional Benefits:
- The market estimate (ME) sheet in Excel format
- 3 months of analyst support
TABLE OF CONTENTS
1 Introduction
- 1.1 Study Assumptions and Market Definition
- 1.2 Scope of the Study
2 Research Methodology
3 Executive Summary
4 Market Landscape
- 4.1 Market Overview
- 4.2 Market Drivers
- 4.2.1 Growing automotive parc expansion
- 4.2.2 Rapid industrial and manufacturing growth
- 4.2.3 Nation-wide infrastructure and mining activity boom
- 4.2.4 Marine and fisheries fleet modernization
- 4.2.5 Biodiesel-linked lubricant contamination driving premium additives
- 4.3 Market Restraints
- 4.3.1 Macroeconomic and commodity-price volatility dampening cap-utilization
- 4.3.2 Longer drain-interval synthetic formulations lowering volume/vehicle
- 4.3.3 Crude-oil price swings squeezing margins and price-sensitive buyers
- 4.4 Value Chain Analysis
- 4.5 Regulatory Framework
- 4.6 End-User Trends
- 4.6.1 Automotive Industry
- 4.6.2 Manufacturing Industry
- 4.6.3 Power Generation Industry
- 4.7 Porter's Five Forces
- 4.7.1 Bargaining Power of Suppliers
- 4.7.2 Bargaining Power of Buyers
- 4.7.3 Threat of New Entrants
- 4.7.4 Threat of Substitutes
- 4.7.5 Degree of Competition
5 Market Size and Growth Forecasts (Volume)
- 5.1 By Product Type
- 5.1.1 Automotive Engine Oil
- 5.1.2 Industrial Engine Oil
- 5.1.3 Transmission Fluids
- 5.1.4 Gear Oil
- 5.1.5 Brake Fluids
- 5.1.6 Hydraulic Fluids
- 5.1.7 Greases
- 5.1.8 Process Oil (Including Rubber Process Oil and White Oil)
- 5.1.9 Metalworking Fluids
- 5.1.10 Turbine Oil
- 5.1.11 Transformer Oil
- 5.1.12 Other Product Types
- 5.2 By End-user Industry
- 5.2.1 Automotive
- 5.2.1.1 Passenger Vehicles
- 5.2.1.2 Commercial Vehicles
- 5.2.1.3 Two-Wheelers
- 5.2.2 Marine
- 5.2.3 Aerospace
- 5.2.4 Heavy Equipment
- 5.2.4.1 Construction
- 5.2.4.2 Mining
- 5.2.4.3 Agriculture
- 5.2.5 Industrial
- 5.2.5.1 Power Generation
- 5.2.5.2 Metallurgy and Metalworking
- 5.2.5.3 Textiles
- 5.2.5.4 Oil and Gas
- 5.2.5.5 Other End-Use Industries
- 5.2.1 Automotive
- 5.3 By Base Stock Type
- 5.3.1 Mineral Oil-Based Lubricants
- 5.3.2 Synthetic Lubricants
- 5.3.3 Semi-Synthetic Lubricants
- 5.3.4 Bio-Based Lubricants
6 Competitive Landscape
- 6.1 Market Concentration
- 6.2 Strategic Moves
- 6.3 Market Share (%)/Ranking Analysis
- 6.4 Company Profiles (includes Global level Overview, Market level overview, Core Segments, Financials as available, Strategic Information, Market Rank/Share, Products and Services, Recent Developments)
- 6.4.1 BP Plc (Castrol)
- 6.4.2 Chevron Corporation
- 6.4.3 Exxon Mobil Corporation
- 6.4.4 FUCHS
- 6.4.5 Gulf Oil International Ltd
- 6.4.6 Idemitsu Kosan Co., Ltd.
- 6.4.7 PETRONAS Lubricants International
- 6.4.8 PT Pertamina Lubricants
- 6.4.9 PT Wiraswasta Gemilang Indonesia
- 6.4.10 Shell plc
- 6.4.11 The Lubrizol Corporation
- 6.4.12 TOP 1 Oil Products Company
- 6.4.13 TotalEnergies
7 Market Opportunities and Future Outlook
- 7.1 White-space and Unmet-need Assessment
8 Key Strategic Questions for CEOs

