
PUBLISHER: Mordor Intelligence | PRODUCT CODE: 1911355

PUBLISHER: Mordor Intelligence | PRODUCT CODE: 1911355
Europe Seafood - Market Share Analysis, Industry Trends & Statistics, Growth Forecasts (2026 - 2031)
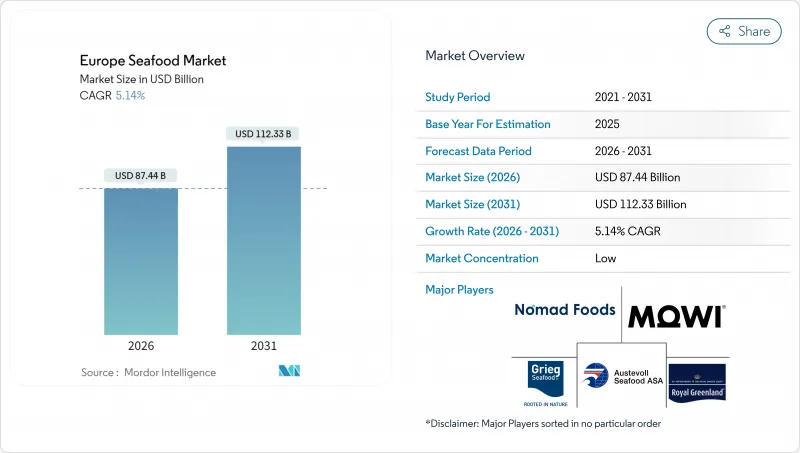
Europe seafood market size in 2026 is estimated at USD 87.44 billion, growing from 2025 value of USD 83.17 billion with 2031 projections showing USD 112.33 billion, growing at 5.14% CAGR over 2026-2031.
This expansion is propelled by the region's decisive pivot toward sustainable aquaculture, robust cold-chain investments and an escalating consumer preference for high-protein diets. Spain anchors nearly one-third of regional demand, underpinned by dual-coast harvesting and processing strengths, while Italy is rising fastest on the back of premium processed offerings and new southern aquaculture licenses. Supermarkets continue to dominate day-to-day sales, yet digital-native consumers are guiding a swift online shift that rewards producers able to assure freshness and traceability. At the product level, fish maintains the foundation of the Europe seafood market, but shrimp is setting the pace for incremental growth as innovative land-based systems overcome past import dependencies.
Europe Seafood Market Trends and Insights
Shifting Consumer Preference to High-Protein Diets
European consumers increasingly prioritize protein-dense nutrition profiles, with seafood consumption rising 12% annually among fitness-conscious demographics seeking alternatives to terrestrial protein sources. The European Food Safety Authority confirms seafood provides complete amino acid profiles with superior bioavailability compared to plant proteins, driving adoption among health-conscious consumers across Germany, Netherlands, and Scandinavia. This dietary transition accelerates particularly in urban markets where disposable income supports premium seafood purchases, while Mediterranean countries leverage traditional seafood consumption patterns to expand into higher-value species and preparation methods. Regulatory compliance frameworks including EU Nutrition and Health Claims Regulation (EC) No 1924/2006 enable seafood marketers to communicate verified health benefits, supporting market penetration among previously protein-supplement-dependent consumer segments.
Expansion of Cold-Chain and Logistics Capacity
Strategic investments in temperature-controlled distribution networks unlock previously inaccessible inland European markets, with cold-chain capacity expanding 18% annually across Central and Eastern European corridors since 2024. The European Commission's Trans-European Transport Network (TEN-T) program allocated EUR 1.2 billion for cold-storage infrastructure development, enabling fresh seafood distribution within 48 hours from coastal processing facilities to interior retail networks. Advanced logistics capabilities particularly benefit Norwegian salmon and Scottish shellfish producers accessing German, Polish, and Czech markets where seafood consumption traditionally lagged due to supply chain limitations. Automated cold-storage facilities in Rotterdam and Hamburg serve as distribution hubs, reducing spoilage rates from 8% to under 3% while extending product shelf life by 40%, directly supporting market expansion into previously underserved geographic segments.
Volatile Capture Fisheries Landings
European capture fisheries face unprecedented volatility with approximately 70% of assessed stocks classified as overfished, creating supply uncertainty that disrupts traditional seafood value chains. The European Environment Agency reports Mediterranean hake populations declined 40% since 2020, while North Sea cod quotas decreased 15% annually, forcing processors to source alternative species or increase aquaculture dependence. Climate-driven species migration patterns shift traditional fishing grounds northward, requiring vessel operators to travel greater distances while facing stricter fuel emission regulations under the EU Emissions Trading System. The European Commission's Total Allowable Catch allocations for 2025 reflect continued stock pressure, with key commercial species including European plaice and Atlantic mackerel subject to reduced quotas that constrain wild-caught seafood availability and elevate raw material costs for processing operations.
Other drivers and restraints analyzed in the detailed report include:
- EU-Funded Sustainability & Traceability Programs
- Growing Demand for Convenience Seafood Meals
- Stringent Import Tariff Quotas on Asian Shrimp
For complete list of drivers and restraints, kindly check the Table Of Contents.
Segment Analysis
Fish generated 78.82% of 2025 revenue, cementing its role as the structural core of the Europe seafood market. Integrated Norwegian salmon chains, Atlantic tuna fleets and Baltic trawlers supply fresh, canned and smoked formats that fit multiple price tiers. Continuous genetic gains, recirculating systems and certified sustainability labels preserve consumer trust and retailer shelf priority.
Shrimp, although smaller today, delivers the momentum. A 5.69% CAGR to 2031 outpaces all other species as land-based biofloc tanks in Spain, Italy and Greece scale to densities above 15 kg/m3, trimming logistics expense versus Asian imports. Organic and antibiotic-free tags fetch 40-60% price uplifts, enlarging the premium slice of the Europe seafood market size. E-commerce and chef-driven restaurant channels further amplify demand for high-grade European shrimp.
Aquaculture secured 68.08% value in 2025, underlining Europe's transition from capricious wild catch toward controlled production. Automation, smart sensors and selective breeding elevate yields while meeting stringent EU environmental codes. Recirculating platforms in Ireland and fully enclosed offshore cages in Norway extend operating seasons and dilute disease risk, supporting dominance in the Europe seafood market.
From 2026-2031, aquaculture's 6.86% CAGR hinges on offshore licensing gains and algae-based feed breakthroughs that cut costs 15%. The European Maritime and Fisheries Fund finances closed-containment pilots and seaweed co-culture, embedding circular-economy returns. Such advances allow domestic fish and shrimp to vie head-on with imported alternatives, widening the Europe seafood market size without escalating ecological footprint.
The Europe Seafood Market is Segmented by Product Type (Fish, Shrimp, Other Seafood), Source (Aquaculture, Wild Catch), Form (Canned, Fresh, Frozen, Processed), Distribution Channel (Supermarkets & Hypermarkets, Convenience Stores, Online Retail, Others), and Geography (France, Germany, Italy, Netherlands, Russia, Spain, United Kingdom, Rest of Europe). The Market Forecasts are Provided in Terms of Value (USD) and Volume (Units).
List of Companies Covered in this Report:
- Associated Seafoods Ltd
- Austevoll Seafood ASA
- Bolton Group SRL
- Grieg Seafood ASA
- Iceland Seafood International hf
- Kilic Seafood Co.
- Mowi ASA
- Nomad Foods Ltd
- Nordic Seafood AS
- Royal Greenland AS
- Seafood King EU BV
- Sofina Foods
- Sykes Seafood Ltd
- Thai Union Group PCL
- Leroy Seafood Group
- SalMar ASA
- Samherji hf
- Nueva Pescanova SA
- Young's Seafood Ltd
- Clearwater Seafoods
Additional Benefits:
- The market estimate (ME) sheet in Excel format
- 3 months of analyst support
TABLE OF CONTENTS
1 Introduction
- 1.1 Scope of the Study
2 Research Methodology
3 Executive Summary
4 Market Landscape
- 4.1 Market Drivers
- 4.1.1 Shifting consumer preference to high-protein diets
- 4.1.2 Expansion of cold-chain and logistics capacity
- 4.1.3 EU-funded sustainability & traceability programs
- 4.1.4 Growing demand for convenience seafood meals
- 4.1.5 Rise of algae-fed aquaculture inputs cutting feed costs
- 4.1.6 Offshore aquaculture licensing liberalization in Nordic EEZs
- 4.2 Market Restraints
- 4.2.1 Volatile capture fisheries landings
- 4.2.2 Stringent import tariff quotas on Asian shrimp
- 4.2.3 Carbon-labeling discouraging high-footprint products
- 4.2.4 Increasing marine-spatial conflicts with offshore wind
- 4.3 Value / Supply-Chain Analysis
- 4.4 Regulatory Landscape
- 4.5 Technological Outlook
- 4.6 Porter's Five Forces
- 4.6.1 Threat of New Entrants
- 4.6.2 Bargaining Power of Suppliers
- 4.6.3 Bargaining Power of Buyers
- 4.6.4 Threat of Substitutes
- 4.6.5 Competitive Rivalry
5 Market Size & Growth Forecasts (Value, Volume)
- 5.1 By Type
- 5.1.1 Fish
- 5.1.1.1 Salmon
- 5.1.1.2 Tuna
- 5.1.1.3 Pollock
- 5.1.1.4 Tilapia
- 5.1.1.5 Others
- 5.1.2 Shrimp
- 5.1.3 Other Seafood (Cephalopods, Bivalves, Etc.)
- 5.1.1 Fish
- 5.2 By source
- 5.2.1 Acquaculture
- 5.2.2 Wild catch
- 5.3 By Form
- 5.3.1 Canned
- 5.3.2 Fresh
- 5.3.3 Frozen
- 5.3.4 Processed (Smoked, Breaded, Ready-to-Eat)
- 5.4 Distribution Channel
- 5.4.1 Supermarkets & Hypermarkets
- 5.4.2 Convenience Stores
- 5.4.3 Online Retail
- 5.4.4 Others
- 5.5 By Country
- 5.5.1 France
- 5.5.2 Germany
- 5.5.3 Italy
- 5.5.4 Netherlands
- 5.5.5 Russia
- 5.5.6 Spain
- 5.5.7 United Kingdom
- 5.5.8 Rest of Europe
6 Competitive Landscape
- 6.1 Strategic Moves
- 6.2 Market Share Analysis
- 6.3 Company Profiles (includes Global level Overview, Market level overview, Core Segments, Financials as available, Strategic Information, Market Rank/Share for key companies, Products & Services, and Recent Developments)
- 6.3.1 Associated Seafoods Ltd
- 6.3.2 Austevoll Seafood ASA
- 6.3.3 Bolton Group SRL
- 6.3.4 Grieg Seafood ASA
- 6.3.5 Iceland Seafood International hf
- 6.3.6 Kilic Seafood Co.
- 6.3.7 Mowi ASA
- 6.3.8 Nomad Foods Ltd
- 6.3.9 Nordic Seafood AS
- 6.3.10 Royal Greenland AS
- 6.3.11 Seafood King EU BV
- 6.3.12 Sofina Foods
- 6.3.13 Sykes Seafood Ltd
- 6.3.14 Thai Union Group PCL
- 6.3.15 Leroy Seafood Group
- 6.3.16 SalMar ASA
- 6.3.17 Samherji hf
- 6.3.18 Nueva Pescanova SA
- 6.3.19 Young's Seafood Ltd
- 6.3.20 Clearwater Seafoods
7 Market Opportunities & Future Outlook

