
PUBLISHER: Mordor Intelligence | PRODUCT CODE: 1911419

PUBLISHER: Mordor Intelligence | PRODUCT CODE: 1911419
North America Road Freight Transport - Market Share Analysis, Industry Trends & Statistics, Growth Forecasts (2026 - 2031)
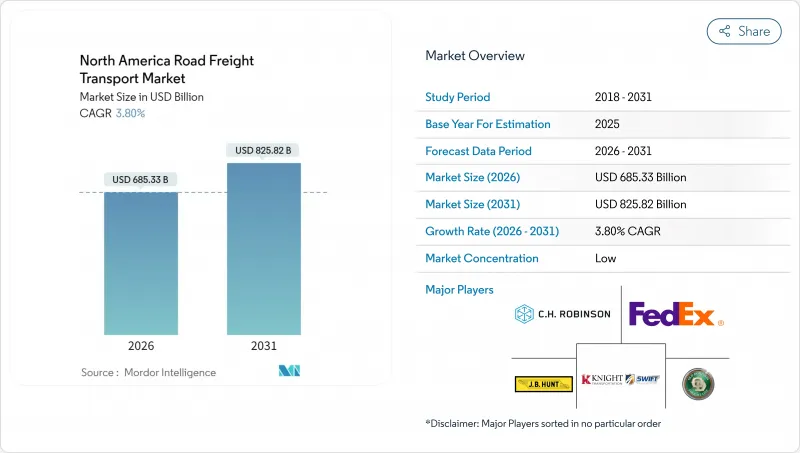
The North America road freight transport market was valued at USD 660.24 billion in 2025 and estimated to grow from USD 685.33 billion in 2026 to reach USD 825.82 billion by 2031, at a CAGR of 3.80% during the forecast period (2026-2031).
This trajectory positions the North America road freight transport market as a steady growth environment sustained by industrial resilience, policy-backed infrastructure upgrades, and rising e-commerce volumes. Nearshoring to Mexico, USMCA-enabled cross-border trade, and inventory decentralization are reshaping freight flows toward shorter-haul, higher-frequency lanes. Shippers continue to favor Full-Truck-Load (FTL) services for cost efficiency, yet the structural rise of Less-than-Truck-Load (LTL) reflects mounting demand for flexible capacity and shipment consolidation. Competitive intensity remains elevated as scale-oriented carriers acquire specialized providers, while widespread adoption of autonomous driving pilots and zero-emission powertrains signals a technology-driven productivity leap. Regulatory trends-most notably greenhouse-gas limits and axle-weight revisions-create compliance costs that smaller fleets struggle to absorb, reinforcing consolidation momentum.
North America Road Freight Transport Market Trends and Insights
E-commerce Last-Mile Boom
Short-haul freight under 100 miles grew 20% annually through 2024 as retailers moved stock closer to consumers to meet same-day delivery promises. Dense metropolitan demand strains terminal capacity and intensifies competition for drivers who can navigate urban restrictions. Grocery and pharmaceutical e-commerce channels push temperature-controlled freight investment, prompting carriers to expand refrigerated fleets. Route-optimization algorithms focus on stop density rather than distance, advantaging regional specialists with urban expertise. Local ordinances on delivery time windows and zero-emission zones accelerate early adoption of battery-electric vans for final-mile routes.
Government Infrastructure Stimulus
The Infrastructure Investment and Jobs Act earmarks USD 110 billion for highways and bridges, unlocking lane additions and bottleneck removals that lower transit times and boost truck productivity. Minnesota identified 22 freight chokepoints causing over 4 hours of daily truck delay per mile; similar pain points exist in Illinois, Texas, and California. Project completions scheduled between 2025-2028 will expand capacity on key corridors such as I-35 and I-95, although construction detours may temporarily suppress throughput. Better pavement quality reduces maintenance expenses, extending tractor-trailer life cycles and lowering the total cost of ownership.
Driver Shortage and Wage Inflation
Retirements outpace new Commercial Driver's License entrants, leaving fleets short by an estimated 80,000 drivers in 2024. Carrier surveys cite double-digit pay increases, retention bonuses, and schedule flexibility as key cost escalators. Specialized segments-hazmat, oversized, and refrigerated-face steeper shortages due to extra certification hurdles. Lifestyle factors and hours-of-service limits deter younger recruits, compelling fleets to invest in driver-assist technology and drop-trailer programs to reduce waiting times.
Other drivers and restraints analyzed in the detailed report include:
- USMCA-Fueled Cross-Border Volumes
- Near-Shoring Shift to Mexico
- Fuel-Price Volatility
For complete list of drivers and restraints, kindly check the Table Of Contents.
Segment Analysis
Manufacturing generated 31.68% of 2025 revenue, the highest slice of the North America road freight transport market share. Metals, machinery, and automotive parts dominate outbound lane volume, while inbound raw-material flows maintain steady trailer turns. The North America road freight transport market size tied to wholesale and retail trade is poised for faster expansion, aided by omnichannel inventory strategies and micro-fulfillment buildouts.
Wholesale and retail traders reorder stock more frequently and in smaller quantities, fueling LTL shipment growth, and are projected to grow at a CAGR of 4.33% between 2026-2031. Construction freight absorbs a meaningful uplift from stimulus-funded projects, whereas oil-and-gas cargoes fluctuate with commodity cycles. Renewable-energy components-turbine blades, solar panels, and battery packs-enter the "Others" bucket and demand specialized equipment and escorts.
Domestic hauls represented 62.30% of 2025 turnover, reflecting extensive intra-U.S. and intra-Canada distribution networks. Stable regional contracts anchor fleet utilization and limit customs risk, keeping the North America road freight transport market robust during economic swings.
International volumes, while smaller, eye a 4.38% CAGR between 2026-2031. Lower border dwell times and harmonized documentation under USMCA attract shippers seeking one-bill cross-border solutions. Large carriers embed bilingual customer service and bonded warehousing to capitalize on the upswing.
FTL held 79.35% of 2025 sales, underscoring shippers' preference for door-to-door speed and limited handling. Seasonality spikes, notably retail holiday peaks, tighten FTL capacity, pushing spot rates upward and opening openings for contract renegotiations tethered to diesel indexation. The North America road freight transport market size captured by LTL is smaller but should grow faster with a CAGR of 4.18% between 2026-2031 on the back of e-commerce returns and SME shipping needs.
Regional LTL specialists invest heavily in cross-dock automation and API connectivity so customers can rate-shop and track in real time. Knight-Swift's ambition to build a national LTL grid by 2026 illustrates how asset-heavy truckload incumbents diversify toward more balanced revenue streams.
The North America Road Freight Transport Market Report is Segmented by End User Industry (Manufacturing, and More), Destination (Domestic and International), Truckload Specification (FTL and LTL), Distance (Long and Short Haul), Goods Configuration (Fluid Goods and Solid Goods), Temperature Control (Non-Temperature and Temperature Controlled), Containerization, and Country. The Market Forecasts are Provided in Terms of Value (USD).
List of Companies Covered in this Report:
- A.P. Moller - Maersk
- ArcBest
- C.H. Robinson
- Canada Cartage
- CMA CGM Group (including CEVA Logistics)
- DHL Group
- DSV A/S (De Sammensluttede Vognmaend af Air and Sea)
- FedEx
- J.B. Hunt Transport, Inc.
- Knight-Swift Transportation Holdings Inc.
- Landstar System Inc.
- Old Dominion Freight Line
- Penske
- Ryder System, Inc.
- Schneider National, Inc.
- Transportes Marva
- Traxion
- United Parcel Service of America, Inc. (UPS)
- Werner Enterprises Inc.
- XPO, Inc.
Additional Benefits:
- The market estimate (ME) sheet in Excel format
- 3 months of analyst support
TABLE OF CONTENTS
1 Introduction
- 1.1 Study Assumptions and Market Definition
- 1.2 Scope of the Study
2 Research Methodology
3 Executive Summary
4 Market Landscape
- 4.1 Market Overview
- 4.2 GDP Distribution by Economic Activity
- 4.3 GDP Growth by Economic Activity
- 4.4 Economic Performance and Profile
- 4.4.1 Trends in E-Commerce Industry
- 4.4.2 Trends in Manufacturing Industry
- 4.5 Transport and Storage Sector GDP
- 4.6 Logistics Performance
- 4.7 Length of Roads
- 4.8 Export Trends
- 4.9 Import Trends
- 4.10 Fuel Pricing Trends
- 4.11 Trucking Operational Costs
- 4.12 Trucking Fleet Size by Type
- 4.13 Major Truck Suppliers
- 4.14 Road Freight Tonnage Trends
- 4.15 Road Freight Pricing Trends
- 4.16 Modal Share
- 4.17 Inflation
- 4.18 Regulatory Framework
- 4.19 Value Chain and Distribution Channel Analysis
- 4.20 Market Drivers
- 4.20.1 E-Commerce Last-Mile Boom
- 4.20.2 Government Infrastructure Stimulus
- 4.20.3 USMCA-Fuelled Cross-Border Volumes
- 4.20.4 Near-Shoring Shift to Mexico
- 4.20.5 Autonomous-Truck Corridor Roll-Outs
- 4.20.6 Hydrogen-Truck Adoption Momentum
- 4.21 Market Restraints
- 4.21.1 Driver Shortage and Wage Inflation
- 4.21.2 Fuel-Price Volatility
- 4.21.3 Stricter Axle-Weight/GHG Rules
- 4.21.4 Modal Shift to Rail-Intermodal
- 4.22 Technology Innovations in the Market
- 4.23 Porter's Five Forces Analysis
- 4.23.1 Threat of New Entrants
- 4.23.2 Bargaining Power of Buyers
- 4.23.3 Bargaining Power of Suppliers
- 4.23.4 Threat of Substitutes
- 4.23.5 Competitive Rivalry
5 Market Size and Growth Forecasts (Value, USD)
- 5.1 End User Industry
- 5.1.1 Agriculture, Fishing, and Forestry
- 5.1.2 Construction
- 5.1.3 Manufacturing
- 5.1.4 Oil and Gas, Mining and Quarrying
- 5.1.5 Wholesale and Retail Trade
- 5.1.6 Others
- 5.2 Destination
- 5.2.1 Domestic
- 5.2.2 International
- 5.3 Truckload Specification
- 5.3.1 Full-Truck-Load (FTL)
- 5.3.2 Less than-Truck-Load (LTL)
- 5.4 Containerization
- 5.4.1 Containerized
- 5.4.2 Non-Containerized
- 5.5 Distance
- 5.5.1 Long Haul
- 5.5.2 Short Haul
- 5.6 Goods Configuration
- 5.6.1 Fluid Goods
- 5.6.2 Solid Goods
- 5.7 Temperature Control
- 5.7.1 Non-Temperature Controlled
- 5.7.2 Temperature Controlled
- 5.8 Country
- 5.8.1 United States
- 5.8.2 Canada
- 5.8.3 Mexico
- 5.8.4 Rest of North America
6 Competitive Landscape
- 6.1 Market Concentration
- 6.2 Key Strategic Moves
- 6.3 Market Share Analysis
- 6.4 Company Profiles (Includes Global Level Overview, Market Level Overview, Core Segments, Financials as Available, Strategic Information, Market Rank/Share for Key Companies, Products and Services, and Recent Developments)
- 6.4.1 A.P. Moller - Maersk
- 6.4.2 ArcBest
- 6.4.3 C.H. Robinson
- 6.4.4 Canada Cartage
- 6.4.5 CMA CGM Group (including CEVA Logistics)
- 6.4.6 DHL Group
- 6.4.7 DSV A/S (De Sammensluttede Vognmaend af Air and Sea)
- 6.4.8 FedEx
- 6.4.9 J.B. Hunt Transport, Inc.
- 6.4.10 Knight-Swift Transportation Holdings Inc.
- 6.4.11 Landstar System Inc.
- 6.4.12 Old Dominion Freight Line
- 6.4.13 Penske
- 6.4.14 Ryder System, Inc.
- 6.4.15 Schneider National, Inc.
- 6.4.16 Transportes Marva
- 6.4.17 Traxion
- 6.4.18 United Parcel Service of America, Inc. (UPS)
- 6.4.19 Werner Enterprises Inc.
- 6.4.20 XPO, Inc.
7 Market Opportunities and Future Outlook
- 7.1 White-Space and Unmet-Need Assessment

