
PUBLISHER: Mordor Intelligence | PRODUCT CODE: 1911436

PUBLISHER: Mordor Intelligence | PRODUCT CODE: 1911436
Payments - Market Share Analysis, Industry Trends & Statistics, Growth Forecasts (2026 - 2031)
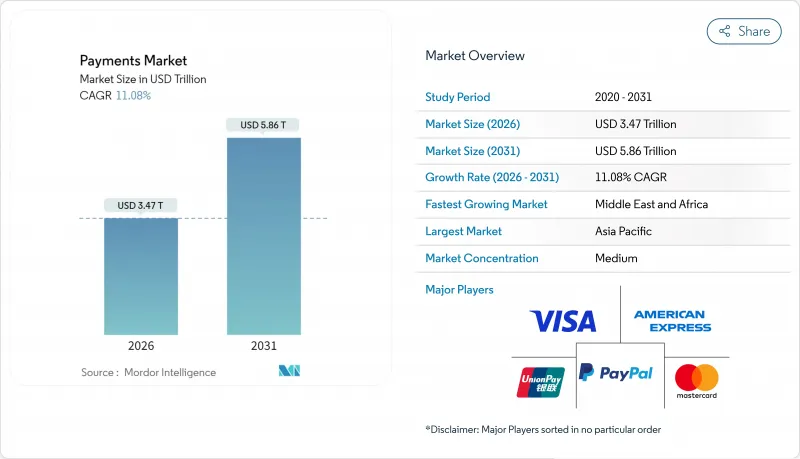
The Payments Market is expected to grow from USD 3.12 trillion in 2025 to USD 3.47 trillion in 2026 and is forecast to reach USD 5.86 trillion by 2031 at 11.08% CAGR over 2026-2031.
Growth is anchored in widespread consumer migration toward mobile-first transactions, the quicker onboarding of financial institutions onto instant-payment rails, and accelerating cross-border e-commerce, which lifts both transaction volume and ticket size. Continued regulatory support for faster payments and uniform data standards quickens account-to-account adoption, while contactless transit programs stimulate tap-to-pay card usage in large metropolitan systems. Competitive intensity remains high as card networks invest in artificial intelligence and tokenization to safeguard volumes, even as digital wallet ecosystems, government-run real-time rails, and emerging fintech intermediaries reduce reliance on traditional interchange economics. Retail leads overall volume, yet healthcare and cross-border remittances provide the fastest incremental opportunities, attracting specialized processors and orchestration platforms.
Global Payments Market Trends and Insights
E-commerce Expansion Driven by Mobile-First Emerging Asia
Digital wallets already support 82% of online purchases and 66% of in-store payments in China, while India passed the 50% adoption milestone across all transaction types in 2024. These adoption curves compress a decade of Western growth into fewer than three years, enabling merchants to lower acceptance costs by 15-20% as QR codes and wallet rails bypass interchange fees and legacy card infrastructure. Cash's share of all Asian transactions is projected to fall to 14% by 2027 as smartphone penetration and super-app ecosystems normalize wallet usage. Spill-over effects arise in the Gulf Cooperation Council and African corridors where Asian fintechs replicate QR standards and super-app playbooks, reinforcing the global payments market trajectory. The granular behavioral data captured inside wallet environments creates monetization paths in lending and loyalty that are unavailable to traditional card networks, further accelerating wallet competition.
Government Instant-Payment Rails Accelerating A2A Adoption in North & Latin America
FedNow enrolled 400 U.S. financial institutions by early 2024, marking a structural break as real-time clearing options become mainstream for domestic transfers. The Federal Reserve's target of onboarding 8,000 institutions will splinter low-value domestic traffic away from card schemes. Brazil's PIX and India's UPI illustrate the network effect: UPI now processes more than 100 billion annual transactions and reaches 50% market penetration, confirming the ability of state-sponsored rails to reset consumer and merchant expectations. ISO 20022 compatibility inside these rails permits rich data payloads that lower reconciliation time for corporate treasurers by as much as 40%. Card networks therefore shift defense toward high-value and cross-border flows, while expanding value-added services such as dispute management and installment options.
Cyber-fraud Sophistication Outpacing AI/ML Defenses in Cross-border Flows
Global fraud losses touched USD 442 billion in 2023, with cross-border channels showing the steepest escalation because attackers exploit latency and jurisdictional silos. Visa has deployed more than 500 AI models and invested over USD 3 billion in data-centric defenses, yet false positives continue to undermine approval rates for high-growth apparel and travel merchants. Real-time payments remove the investigation window formerly provided by batch settlement, amplifying losses when synthetic identities penetrate onboarding filters. The industry's pivot toward behavior-based analytics requires broader data sharing, but competitive sensitivities and privacy regimes impede unified consortium models. The resulting friction slows merchant adoption of new rails and dents consumer confidence, tempering part of the global payments market expansion.
Other drivers and restraints analyzed in the detailed report include:
- Surging Cross-border B2C Remittances Fueling Digital Wallet Uptake in MENA & APAC Corridors
- Contactless Transit & Toll Schemes Catalyzing Tap-to-Pay Card Volumes in Europe & Nordics
- Interchange & MDR Caps Compressing Issuer Margins in EU & India
For complete list of drivers and restraints, kindly check the Table Of Contents.
Segment Analysis
Point-of-sale card transactions held 41.43% of global payments market share in 2025, anchored by decades-old EMV infrastructure and global brand trust. Despite this cushion, wallet and account-to-account flows are compounding at 17.31% annually as QR codes and direct-to-account checkouts reduce acceptance cost. Merchants in Asia can save up to 2 percentage points in fees by steering consumers toward wallets, reinforcing the structural shift. In response, card networks promote network tokens and installment APIs to embed their rails inside wallet ecosystems, seeking to preserve transaction count even if form factors mutate.
The global payments market will still see card volumes increase in absolute terms because total consumption grows, but relative wallet share rises faster. ISO 20022 data-rich messages enhance reconciliation for corporate cards, yet they also enable competitive A2A alternatives carrying the same metadata. Co-branded card issuance remains a strategic hedge for e-commerce giants that want customer data, suggesting coexistence rather than immediate cannibalization.
Physical POS owned 72.20% of 2025 volume, yet e-commerce and mobile commerce are climbing at a 16.11% CAGR, narrowing the gap each year. Merchants therefore accelerate payment-orchestration investments that blend online and in-store acceptance inside one API to lower vendor complexity. Digital wallets accounted for 53% of online spend in 2025, lifted by "one-click" checkout and smartphone NFC. Cash's share of in-store spend has fallen from 44% to 15% in a decade, freeing physical retailers to repurpose cash-office labor.
Within the global payments market, restaurants and quick-service operators deploy QR-based ordering that routes payments through e-commerce rails even while customers sit in-store. Wearables extend the notion of card present to watches and rings, raising the need for tokenization at the edge. Payment service providers differentiate on orchestration dashboards that expose granular approval, retry, and cost data, enabling CFOs to treat payments as a managed P&L line item rather than a binary pass/fail utility.
The Payments Industry Market Report Segmented Into Mode of Payment (Point of Sale, Online Sale), End-User Industry (Retail, , Healthcare, and More), Interaction Channel (Point-Of-Sale, E-commerce/M-commerce), Transaction Type (Person-To-Person (P2P), Consumer-To-Business (C2B) and More) and Geography. The Market Forecasts are Provided in Terms of Value (USD).
Geography Analysis
Asia-Pacific led the global payments market with 37.62% revenue in 2025, propelled by China's wallet duopoly and India's UPI scaling beyond 100 billion annual transactions. Wallet penetration across Southeast Asia accelerates because merchants adopt dynamic QR standards that interoperate across schemes. Regional governments continue piloting central-bank digital currencies for retail use, which could further elevate account-based flows over cards.
The Middle East & Africa segment delivers the fastest 15.12% CAGR to 2031 as mobile-money operators convert cash-heavy populations through agent networks and lightweight KYC. The Pan-African Payment and Settlement System promises intra-African instant payments in local currencies, a structural boost for small-business trade. Gulf regulators push open-banking mandates and explore a digital dirham, drawing global payment processors to establish regional hubs.
North America sustains high average ticket sizes on credit cards, yet FedNow's real-time rails create an alternate domestic path for bill payments and gig-economy payouts. Europe prioritizes cost-reduction and sovereignty through the European Payments Initiative's Wero wallet, while transit networks leverage contactless ticketing to lift card volume. Latin America sees Brazil's PIX benchmark incentivizing peers like Colombia and Peru to fast-track instant-payment programs, while CBDC pilots explore offline wallets for financial-inclusion goals.
- Visa Inc.
- Mastercard Incorporated
- China UnionPay Co., Ltd.
- Ant Group Co., Ltd. (Alipay)
- PayPal Holdings, Inc.
- Apple Inc. (Apple Pay)
- Google LLC (Google Pay)
- Amazon.com, Inc. (Amazon Pay)
- American Express Company
- Adyen N.V.
- Stripe, Inc.
- Block, Inc. (Square & Afterpay)
- Worldline SA
- Fidelity National Information Services, Inc. (FIS)
- Fiserv, Inc.
- Global Payments Inc.
- Klarna Bank AB
- Razorpay Software Pvt. Ltd.
- PayU Payments Pvt. Ltd.
- Revolut Ltd.
Additional Benefits:
- The market estimate (ME) sheet in Excel format
- 3 months of analyst support
TABLE OF CONTENTS
1 INTRODUCTION
- 1.1 Study Assumptions and Market Definition
- 1.2 Scope of the Study
2 RESEARCH METHODOLOGY
3 EXECUTIVE SUMMARY
4 MARKET LANDSCAPE
- 4.1 Market Overview
- 4.2 Market Drivers
- 4.2.1 E-commerce Expansion Driven by Mobile-First Emerging Asia
- 4.2.2 Government Instant-Payment Rails (e.g., FedNow, UPI, PIX) Accelerating A2A Adoption in North & Latin America
- 4.2.3 Surging Cross-border B2C Remittances Fueling Digital Wallet Uptake in MENA & APAC Corridors
- 4.2.4 Contactless Transit & Toll Schemes Catalyzing Tap-to-Pay Card Volumes in Europe & Nordics
- 4.2.5 BNPL Integration by Tier-1 Retailers Boosting Ticket-Size & Frequency in Oceania
- 4.2.6 ISO 20022 Migration Enabling Rich-Data Corporate Payments in Developed Markets
- 4.3 Market Restraints
- 4.3.1 Cyber-fraud Sophistication Outpacing AI/ML Defenses in Cross-border Flows
- 4.3.2 Interchange & MDR Caps Compressing Issuer Margins in EU & India
- 4.3.3 Legacy Core-Banking Inflexibility Delaying Real-time Settlement in Africa
- 4.3.4 High Cash Reliance in Rural Caribbean Economies
- 4.4 Value Chain Analysis
- 4.5 Regulatory Outlook
- 4.6 Porter's Five Forces Analysis
- 4.6.1 Bargaining Power of Suppliers
- 4.6.2 Bargaining Power of Buyers/Consumers
- 4.6.3 Threat of New Entrants
- 4.6.4 Threat of Substitute Products
- 4.6.5 Intensity of Competitive Rivalry
- 4.7 Sustainability & Green-Payments Initiatives
- 4.8 Analysis of key demographic trends and patterns related to Global payments industry (Coverage to include Population, Internet Penetration, Banking Penetration/Unbanking Population, Age & Income etc.)
- 4.9 Analysis of major case studies and use-cases
- 4.10 Assessment of Macro Economic Trends on the Market
5 MARKET SIZE AND GROWTH FORECASTS (VALUES)
- 5.1 By Mode of Payment
- 5.1.1 Point-of-Sale
- 5.1.1.1 Card (Debit, Credit, Pre-paid)
- 5.1.1.2 Digital Wallets (Apple Pay, Google Pay, Interac Flash)
- 5.1.1.3 Cash
- 5.1.1.4 Other POS (Gift-cards, QR, Wearables)
- 5.1.2 Online
- 5.1.2.1 Card (Card-Not-Present)
- 5.1.2.2 Digital Wallet & Account-to-Account (Interac e-Transfer, PayPal)
- 5.1.2.3 Other Online (COD, BNPL, Bank Transfer)
- 5.1.1 Point-of-Sale
- 5.2 By Interaction Channel
- 5.2.1 Point-of-Sale
- 5.2.2 E-commerce/M-commerce
- 5.3 By Transaction Type
- 5.3.1 Person-to-Person (P2P)
- 5.3.2 Consumer-to-Business (C2B)
- 5.3.3 Business-to-Business (B2B)
- 5.3.4 Remittances & Cross-border
- 5.4 By End-user Industry
- 5.4.1 Retail
- 5.4.2 Entertainment & Digital Content
- 5.4.3 Healthcare
- 5.4.4 Hospitality & Travel
- 5.4.5 Government & Utilities
- 5.4.6 Other End-user Industries
- 5.5 By Geography
- 5.5.1 North America
- 5.5.1.1 United States
- 5.5.1.2 Canada
- 5.5.1.3 Mexico
- 5.5.2 Europe
- 5.5.2.1 Germany
- 5.5.2.2 United Kingdom
- 5.5.2.3 France
- 5.5.2.4 Nordics
- 5.5.2.5 Rest of Europe
- 5.5.3 Asia-Pacific
- 5.5.3.1 China
- 5.5.3.2 India
- 5.5.3.3 Japan
- 5.5.3.4 Rest of Asia-Pacific
- 5.5.4 South America
- 5.5.4.1 Brazil
- 5.5.4.2 Argentina
- 5.5.4.3 Rest of South America
- 5.5.5 Middle East
- 5.5.5.1 United Arab Emirates
- 5.5.5.2 Saudi Arabia
- 5.5.5.3 Rest of Middle East
- 5.5.6 Africa
- 5.5.6.1 South Africa
- 5.5.6.2 Nigeria
- 5.5.6.3 Rest of Africa
- 5.5.1 North America
6 COMPETITIVE LANDSCAPE
- 6.1 Market Concentration
- 6.2 Strategic Moves
- 6.3 Market Share Analysis
- 6.4 Company Profiles (includes Global-level Overview, Market-level Overview, Core Segments, Financials as available, Strategic Information, Market Rank/Share, Products & Services, and Recent Developments)
- 6.4.1 Visa Inc.
- 6.4.2 Mastercard Incorporated
- 6.4.3 China UnionPay Co., Ltd.
- 6.4.4 Ant Group Co., Ltd. (Alipay)
- 6.4.5 PayPal Holdings, Inc.
- 6.4.6 Apple Inc. (Apple Pay)
- 6.4.7 Google LLC (Google Pay)
- 6.4.8 Amazon.com, Inc. (Amazon Pay)
- 6.4.9 American Express Company
- 6.4.10 Adyen N.V.
- 6.4.11 Stripe, Inc.
- 6.4.12 Block, Inc. (Square & Afterpay)
- 6.4.13 Worldline SA
- 6.4.14 Fidelity National Information Services, Inc. (FIS)
- 6.4.15 Fiserv, Inc.
- 6.4.16 Global Payments Inc.
- 6.4.17 Klarna Bank AB
- 6.4.18 Razorpay Software Pvt. Ltd.
- 6.4.19 PayU Payments Pvt. Ltd.
- 6.4.20 Revolut Ltd.
7 MARKET OPPORTUNITIES AND FUTURE OUTLOOK
- 7.1 White-space and Unmet-need Assessment

