
PUBLISHER: Mordor Intelligence | PRODUCT CODE: 1911711

PUBLISHER: Mordor Intelligence | PRODUCT CODE: 1911711
Urea - Market Share Analysis, Industry Trends & Statistics, Growth Forecasts (2026 - 2031)
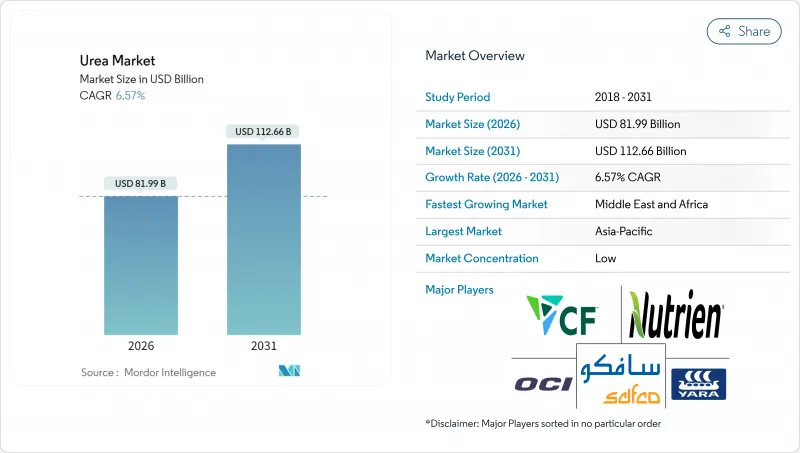
The urea market was valued at USD 76.95 billion in 2025 and estimated to grow from USD 81.99 billion in 2026 to reach USD 112.66 billion by 2031, at a CAGR of 6.57% during the forecast period (2026-2031).
Rapid cereal acreage expansion and the first commercial green hydrogen projects are reshaping production economics while keeping demand on an upward trajectory. Producers with long-term natural gas contracts protect margins during price spikes, yet distributed port-side plants and renewable-powered ammonia units are beginning to reset regional cost curves. In parallel, governments tighten runoff rules, which steer demand toward coated and stabilized products that command higher average selling prices. These converging forces encourage strategic hedging in feedstock sourcing, deeper integration with logistics assets, and accelerated R&D in enhanced-efficiency fertilizer formulations.
Global Urea Market Trends and Insights
Intensifying Cereal Crop Cultivation Worldwide
Escalating global cereal acreage keeps nitrogen demand on a solid climb as farmers strive to meet a 28% production increase by 2030. High-yield wheat, rice, and maize programs in India, China, and parts of Africa absorb large volumes of granular urea that are compatible with GPS-guided spreaders. India's nano urea rollout shows how dosage optimization can reduce environmental load without cutting nutrient supply. Government input subsidies in Sub-Saharan Africa further lift application rates and introduce smallholder farmers to coated products that slow nitrogen release. Brazil's Plano Nacional de Fertilizantes backs domestic capacity to curb import reliance while supporting expanding soybean and corn acreages. Favorable commodity prices sustain acreage gains, strengthening long-run consumption fundamentals for the urea market.
Fertilizers reliance on nitrogen as a key nutrient
Globally, crops such as corn, rapeseed, cotton, sorghum, rice, wheat, and soybeans are major consumers of essential nutrients. In 2024, these key crops exhibit varying nutritional requirements, with an average application rate of primary nutrients ranging from 120.97 kg/ha to 255.75 kg/ha. These nutrients are critical for supporting plant metabolic processes and the development of essential tissues, including cells, membranes, and chlorophyll. Nitrogen remains the most widely applied nutrient, with an average application rate of 224.6 kg/ha. As the cultivation area for field crops continues to expand, particularly in South America and the Asia-Pacific regions, regions such as Europe and North America, facing nutrient deficiencies, are increasingly adopting urea specialty fertilizers due to their efficiency.
Natural Gas Price Volatility Raising Production Costs
Feedstock accounts for up to 80% of ex-works urea pricing. When European benchmark gas cleared EUR 300 per MWh (USD 324 per MWh) in 2022, several plants idled rather than operate at negative margins. Producers with upstream integration, such as SABIC in Saudi Arabia, preserve profitability through captive gas. Others deploy hedging programs, yet still confront cash burn when spot spikes surpass hedge coverage. This volatility quickens the shift toward regions with stable gas supply, stimulates adoption of ammonia imports for modular plants, and rekindles interest in renewable hydrogen at declining power tariffs.
Other drivers and restraints analyzed in the detailed report include:
- Cost Advantage of Urea Versus Other Nitrogen Fertilizers
- Growing Preference for Granular Urea in Precision Farming
- Tightening Runoff and Greenhouse Gas Regulations on Nitrogen Use
For complete list of drivers and restraints, kindly check the Table Of Contents.
Segment Analysis
Water-soluble urea fertilizers have emerged as the dominant segment in the specialty urea fertilizers market, commanding 40.35% market share in 2025. Urea, being rich in nitrogen and easily soluble in water, significantly enhances nitrogen uptake by plant roots, thereby stimulating growth. The segment's dominance is primarily driven by shifting climatic patterns, including droughts, heatwaves, and escalating water scarcity worldwide, which have curtailed nitrogen availability in soils. Farmers increasingly prefer water-soluble urea fertilizers as they ensure a consistent nitrogen supply while mitigating nitrogen leaching, volatilization, and associated risks of environmental pollution and groundwater contamination.Controlled-release urea is the fastest-growing segment with a CAGR of 7.28% during the forecast period 2026-2031, as farmers and agribusinesses increasingly adopt efficiency-enhancing inputs to reduce nitrogen losses and comply with sustainability standards. Polymer-coated and polymer sulfur-coated formulations provide extended nutrient release, minimizing leaching and volatilization while improving labor efficiency through reduced application frequency. This growth is further driven by regulatory requirements for nutrient management and the rising use of controlled-release fertilizers in cereals, oilseeds, and specialty crops. The demand for controlled-release urea is accelerating year-on-year as growers aim to achieve higher productivity with reduced environmental impact.
The Urea Market Report Segments the Industry Into Speciality Type (CRF, Liquid Fertilizer, SRF, and Water Soluble), Crop Type (Field Crops, Horticultural Crops, and Turf & Ornamental), Form (Conventional and Speciality), and Region (Asia-Pacific, Europe, Middle East & Africa, North America, and South America). The Market Size is Provided in Terms of Value(USD) and Volume(Metric Tons).
Geography Analysis
Asia-Pacific accounted for 44.92% of 2025 revenue, driven by intensive cereal cultivation in China and India. Growth is further supported by expanding acreage and the adoption of mechanized fertilizing equipment in Vietnam, Indonesia, and the Philippines. In China, fertilizer reduction mandates are encouraging the use of nano urea and coated products, leading to higher spending per hectare despite stable total nutrient tonnage. In India, subsidy reforms promote balanced nutrient management, increasing demand for higher-value formulations over generic prills. Additionally, the ASEAN hydrogen roadmap is preparing the region for low-carbon ammonia imports, which could support future green urea production.
The Middle East and Africa are the fastest-growing regions, with a projected CAGR of 9.17%. Growth is driven by capacity expansions in Saudi Arabia, the UAE, and Nigeria, supported by low-cost gas that enhances export competitiveness. Local farm subsidy programs are also boosting demand in inland areas. Nigeria's Dangote complex serves both domestic and West African markets, reducing dependency on offshore imports. Gulf Cooperation Council countries are exploring solar-powered electrolyzers for green ammonia production, positioning themselves to attract carbon-conscious buyers in Europe and Asia. However, infrastructure gaps and political instability in parts of Sub-Saharan Africa pose challenges, though donor-backed agronomic extension programs continue to support fertilizer adoption.
North America and Europe exhibit mature but steady growth trajectories. In North America, shale gas ensures that fertilizer plants remain among the first-quartile cost producers, sustaining export flows to Latin America. In Europe, stricter farm policies on nutrient caps are driving the adoption of granular coated products. Import terminals in Germany and Belgium are expanding sourcing options, with ammonia imports from North Africa and the Middle East compensating for reduced local production during periods of high gas prices.
- CF Industries Holdings, Inc.
- Coromandel International Ltd.
- EuroChem Group
- Indian Farmers Fertiliser Cooperative Limited
- Koch Industries Inc.
- Nutrien Ltd.
- OCI NV
- SABIC Agri-Nutrients Co.
- Yara International ASA
- Qatar Fertiliser Company (QAFCO)
- PT Pupuk Kalimantan Timur
- Rashtriya Chemicals and Fertilizers Limited
- Acron Group (Acron PJSC)
- BASF SE
- URALCHEM Holding P.L.C.
- The Mosaic Company
Additional Benefits:
- The market estimate (ME) sheet in Excel format
- 3 months of analyst support
TABLE OF CONTENTS
1 INTRODUCTION
- 1.1 Study Assumptions & Market Definition
- 1.2 Scope of the Study
- 1.3 Research Methodology
2 REPORT OFFERS
3 EXECUTIVE SUMMARY & KEY FINDINGS
4 KEY INDUSTRY TRENDS
- 4.1 Acreage Of Major Crop Types
- 4.1.1 Field Crops
- 4.1.2 Horticultural Crops
- 4.2 Average Nutrient Application Rates
- 4.2.1 Micronutrients
- 4.2.1.1 Field Crops
- 4.2.1.2 Horticultural Crops
- 4.2.1 Micronutrients
- 4.3 Primary Nutrients
- 4.3.1 Field Crops
- 4.3.2 Horticultural Crops
- 4.4 Agricultural Land Equipped For Irrigation
- 4.5 Regulatory Framework
- 4.6 Value Chain & Distribution Channel Analysis
- 4.7 Market Drivers
- 4.7.1 Intensifying cereal crop cultivation
- 4.7.2 Fertilizers reliance on nitrogen as a key nutrient
- 4.7.3 Cost advantage of urea versus other nitrogen fertilizers
- 4.7.4 Growing preference for granular urea in precision farming
- 4.7.5 Renewable-hydrogen-based green urea capacity additions
- 4.7.6 Port-side modular urea plants lowering logistics costs
- 4.8 Market Restraints
- 4.8.1 Natural gas price volatility raising production costs
- 4.8.2 Tightening runoff and greenhouse gas regulations on nitrogen use
- 4.8.3 Substitution threat from ammonium nitrate and UAN
- 4.8.4 Geopolitical trade-route disruptions
5 MARKET SIZE AND GROWTH FORECASTS (VALUE AND VOLUME)
- 5.1 Speciality Type
- 5.1.1 CRF
- 5.1.1.1 Polymer Coated
- 5.1.1.2 Polymer-Sulfur Coated
- 5.1.1.3 Others
- 5.1.2 Liquid Fertilizer
- 5.1.3 SRF
- 5.1.4 Water Soluble
- 5.1.1 CRF
- 5.2 Crop Type
- 5.2.1 Field Crops
- 5.2.2 Horticultural Crops
- 5.2.3 Turf & Ornamental
- 5.3 Form
- 5.3.1 Conventional
- 5.3.2 Speciality
- 5.4 Region
- 5.4.1 Asia-Pacific
- 5.4.1.1 Australia
- 5.4.1.2 Bangladesh
- 5.4.1.3 China
- 5.4.1.4 India
- 5.4.1.5 Indonesia
- 5.4.1.6 Japan
- 5.4.1.7 Pakistan
- 5.4.1.8 Philippines
- 5.4.1.9 Thailand
- 5.4.1.10 Vietnam
- 5.4.1.11 Rest of Asia-Pacific
- 5.4.2 Europe
- 5.4.2.1 France
- 5.4.2.2 Germany
- 5.4.2.3 Italy
- 5.4.2.4 Netherlands
- 5.4.2.5 Russia
- 5.4.2.6 Spain
- 5.4.2.7 Ukraine
- 5.4.2.8 United Kingdom
- 5.4.2.9 Rest of Europe
- 5.4.3 Middle East & Africa
- 5.4.3.1 Nigeria
- 5.4.3.2 Saudi Arabia
- 5.4.3.3 South Africa
- 5.4.3.4 Turkey
- 5.4.3.5 Rest of Middle East & Africa
- 5.4.4 North America
- 5.4.4.1 Canada
- 5.4.4.2 Mexico
- 5.4.4.3 United States
- 5.4.4.4 Rest of North America
- 5.4.5 South America
- 5.4.5.1 Argentina
- 5.4.5.2 Brazil
- 5.4.5.3 Rest of South America
- 5.4.1 Asia-Pacific
6 COMPETITIVE LANDSCAPE
- 6.1 Key Strategic Moves
- 6.2 Market Share Analysis
- 6.3 Company Landscape
- 6.4 Company Profiles (Includes Global Level Overview, Market Level Overview, Core Business Segments, Financials, Headcount, Key Information, Market Rank, Market Share, Products and Services, and Analysis of Recent Developments).
- 6.4.1 CF Industries Holdings, Inc.
- 6.4.2 Coromandel International Ltd.
- 6.4.3 EuroChem Group
- 6.4.4 Indian Farmers Fertiliser Cooperative Limited
- 6.4.5 Koch Industries Inc.
- 6.4.6 Nutrien Ltd.
- 6.4.7 OCI NV
- 6.4.8 SABIC Agri-Nutrients Co.
- 6.4.9 Yara International ASA
- 6.4.10 Qatar Fertiliser Company (QAFCO)
- 6.4.11 PT Pupuk Kalimantan Timur
- 6.4.12 Rashtriya Chemicals and Fertilizers Limited
- 6.4.13 Acron Group (Acron PJSC)
- 6.4.14 BASF SE
- 6.4.15 URALCHEM Holding P.L.C.
- 6.4.16 The Mosaic Company
7 KEY STRATEGIC QUESTIONS FOR FERTILIZER CEOS

