
PUBLISHER: Mordor Intelligence | PRODUCT CODE: 1939015

PUBLISHER: Mordor Intelligence | PRODUCT CODE: 1939015
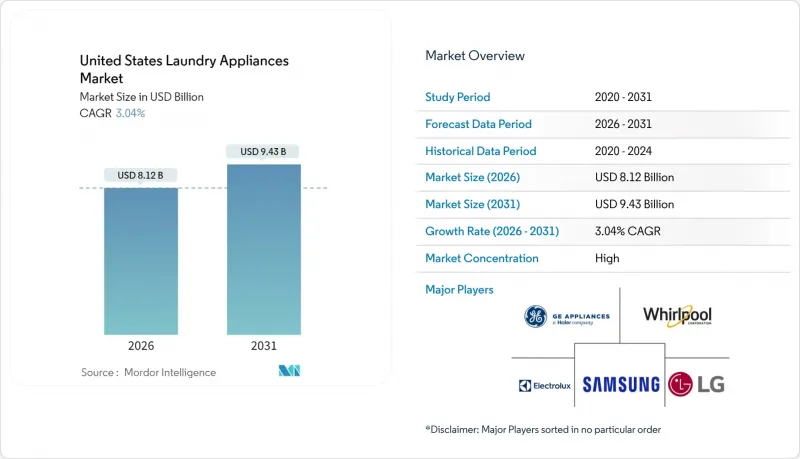
United States Laundry Appliances - Market Share Analysis, Industry Trends & Statistics, Growth Forecasts (2026 - 2031)
The United States laundry appliance market was valued at USD 7.88 billion in 2025 and estimated to grow from USD 8.12 billion in 2026 to reach USD 9.43 billion by 2031, at a CAGR of 3.04% during the forecast period (2026-2031).
Replacement cycles tied to the average 12-year lifespan of washers and dryers, federal efficiency mandates that phase out legacy models, and incremental housing starts constitute the fundamental growth engines, whereas first-time purchases contribute very little because household penetration is already nearing 96%. . Competitive intensity remains high as the top five manufacturers command roughly 85% of the United States laundry appliance market share, creating pricing discipline but driving heavy investment in smart connectivity, heat-pump drying, and ENERGY STAR upgrades that carry higher gross margins. Regionally, the South anchors demand at 38.73% share on the back of strong in-migration and new construction, while the West leads growth with a 5.37% CAGR owing to stringent California efficiency regulations that accelerate premium adoption. The commercial sub-segment, though only 6.25% of value, is set to advance 6.24% CAGR on multifamily construction and laundromat modernization, adding a valuable counter-cyclical revenue stream as residential volumes plateau.
United States Laundry Appliances Market Trends and Insights
Housing Starts & Replacement Cycles Drive Core Demand
Single-family starts are projected to reach 1.01 million units in 2025, up from multiyear lows and aligned with a 5% remodeling uptick that typically channels into laundry room upgrades. Each new house installs roughly 1.2 laundry units, creating a lagged but predictable volume cue that manufacturers use for plant-level planning. The average 12-year replacement cycle further smooths demand, yielding a rolling baseline even in weak macro years and helping firms forecast component procurement. Whirlpool's 2024 North America revenue decline of 5.7% illustrated how sharply appliance volumes react when existing-home sales stall, yet its internal data show replacements rebounding as mortgage markets stabilize. . The cycle also enables targeted promotions timed to exceed warranty expiry, reinforcing brand retention. Overall, replacement-led demand provides visibility but not breakout volume growth, directing corporate strategy toward attached services and premium models.
Energy-Efficient ENERGY STAR Adoption Accelerates Market Premiumization
Mandatory federal clothes-washer and dryer standards effective March 2028 remove lower-performing SKUs and lift the entire price curve, which benefits manufacturers that invested early in heat-pump technology and hybrid drum designs. . ENERGY STAR commercial washers already deliver 9% better energy use and 45% water savings versus baseline units, setting de-facto targets for residential products. Inflation Reduction Act rebates of up to USD 840 per heat-pump dryer shorten consumer payback to as few as three years, encouraging premium adoption in high-cost electricity states. Corporate R&D pipelines now emphasize variable-speed motors, refrigerant-loop dryers, and micro-fiber filtration systems that unlock future compliance margins. Meanwhile, utilities in California and New York offer demand-response credits that further tilt the economics toward smart, efficient models. Collectively, these measures stimulate revenue mix shift rather than raw unit growth, a dynamic that favors the top quintile of brands on technology readiness.
Raw-Material Cost Inflation Pressures Manufacturer Margins
Steel, resins, and electronic controllers compose 35-40% of washer-dryer bill of materials, making P&L performance hypersensitive to commodity price swings. During 2024, domestic hot-rolled-coil averaged USD 920 per ton, up 18% versus prior year, prompting Whirlpool to execute USD 300 million in operational savings and target an additional USD 200 million for 2025. Companies negotiate multi-year contracts and deploy dual-sourcing to mitigate volatility, yet tariffs and freight bottlenecks still compress gross margin. Carbon-pricing proposals add upside risk because iron-and-steel accounts for 11.1% of national industrial GHG emissions. To offset costs, OEMs rationalize SKU counts, substitute plastics for sheet metal where feasible, and push price increases timed to new model launches. Nonetheless, prolonged inflation can delay consumer upgrades, especially in value segments, suppressing total unit throughput.
Other drivers and restraints analyzed in the detailed report include:
- Smart Connected Laundry Machines Create Ecosystem Revenue Streams
- Multi-Family Housing & Laundromat Demand Sustains Commercial Growth
- Household Saturation Limits Unit Growth to Replacement Cycles
For complete list of drivers and restraints, kindly check the Table Of Contents.
Segment Analysis
Stand-alone washers held 49.98% share in 2025, reflecting long-standing consumer preference for high-capacity tubs and independent drying cycles. The United States laundry appliance market size for combined washer-dryers, however, is projected to post a 9.72% CAGR thanks to urbanization that prizes every square foot. LG's 25-kg combo with a ventless heat pump exemplifies how integrated units now rival separate devices on cycle time and fabric care, erasing historical performance trade-offs. Manufacturers exploit this shift to capture higher ASPs, bundling Wi-Fi diagnostics and fabric-identification sensors that automatically switch from wash to dry without user input. Retailers increasingly allocate end-cap placements to combos, especially in coastal cities where stacked installations dominate. Supply-chain complexity rises because combo units require broader certification regimes, yet the gross-margin lift offsets added engineering cost. Over 2026-2031, combined units are expected to cannibalize roughly 6% of replacement purchases from separate dryers, subtly reshaping plant-utilization plans among leading OEMs.
Both product architectures must comply with the Department of Energy's 2028 standard that sets a Combined Energy Factor of 3.93 for electric dryers, forcing even mid-tier brands to employ inverter compressors or variable-resistance elements. This regulatory ceiling may accelerate market consolidation as smaller assemblers lack R&D depth. At the same time, stand-alone dryers remain relevant for households with dedicated venting and higher throughput needs; their road map centers on moisture sensing and reverse-tumble algorithms that cut overdry energy by up to 20%. Thus, the product-type landscape will evolve toward a bimodal distribution: premium all-in-one systems for dense metros and high-capacity separates for suburban households.
Top-load designs accounted for 57.92% of the United States laundry appliance market share in 2025 thanks to faster cycles, easier detergent insertion, and the cultural norm of adding forgotten garments mid-wash. Yet front-load units are rising at 6.76% CAGR, driven by 30-45% water savings and stackable form factors indispensable in apartments. California's July 2024 rule tightened allowable integrated-modified-energy-factor thresholds, effectively eliminating non-high-efficiency top-loaders from big-box assortments. Utility rebates of USD 150-250 further tilt the economics, especially when paired with tiered electric rates that reward lower kilowatt-hour consumption. Manufacturers countertop-load headwinds by adding impeller plates instead of central agitators, enabling near-front-load performance while preserving familiar ergonomics. The marketing narrative now pivots around personalization: Whirlpool's 2-in-1 top-load model with detachable agitator lets users choose wash action per load, bridging both camps. Over the outlook period, front-load penetration is expected to cross 50% in coastal states but remain secondary in the Midwest, where basements provide ample space and cheaper water dilutes savings.
From an operations standpoint, front-load units carry higher production complexity due to door boot seals and counterweights; nonetheless, their ASP premium offsets cost. Retailers leverage the visual appeal of front-load suites, arranging color-matched washer-dryer pairs under accent lighting to drive package sales. Meanwhile, top-load SKUs continue to dominate entry-price tiers that anchor volume metrics at mass merchants. Therefore loading-type competition will remain a key battleground in channel strategy and feature road maps.
The United States Laundry Appliance Market Report is Segmented by Product Type (Stand-Alone Washing Machines, Stand-Alone Drying Machines/Dryers, Combined Washer-Dryers), Loading Type (Front-Load, Top-Load), Capacity (Below 6 Kg, 6-8 Kg, Above 8 Kg), Usage (Residential, Commercial), Distribution Channel (B2B/Direct, B2C/Retail), and Geography (Northeast, and Other). The Market Forecasts are Provided in Terms of Value (USD).
List of Companies Covered in this Report:
- Whirlpool Corporation
- LG Electronics USA
- Samsung Electronics America
- GE Appliances (a Haier company)
- Electrolux (North America)
- Bosch Home Appliances
- Miele USA
- Alliance Laundry Systems (Speed Queen, Huebsch)
- Maytag (Whirlpool brand)
- Amana (Whirlpool brand)
- Kenmore (Transform co.)
- Haier America
- Panasonic North America
- Fisher & Paykel Appliances
- Danby Appliances
- Hisense USA
- Speed Queen Commercial
- Dexter Laundry
- Continental Girbau
- Girbau North America
Additional Benefits:
- The market estimate (ME) sheet in Excel format
- 3 months of analyst support
TABLE OF CONTENTS
1 Introduction
- 1.1 Study Assumptions & Market Definition
- 1.2 Scope of the Study
2 Research Methodology
3 Executive Summary
4 Market Landscape
- 4.1 Market Overview
- 4.2 Market Drivers
- 4.2.1 Housing starts & replacement cycles
- 4.2.2 Energy-efficient 'ENERGY STAR' adoption
- 4.2.3 Smart, connected laundry machines
- 4.2.4 Multi-family housing & laundromat demand
- 4.2.5 High-capacity washers for athleisure/bedding
- 4.2.6 Premium steam-sanitization features
- 4.3 Market Restraints
- 4.3.1 Raw-material cost inflation
- 4.3.2 Household saturation limits unit growth
- 4.3.3 Price wars from low-cost Asian brands
- 4.3.4 Water-use restrictions in drought states
- 4.4 Value / Supply-Chain Analysis
- 4.5 Regulatory Landscape
- 4.6 Technological Outlook
- 4.7 Porter's Five Forces
- 4.7.1 Threat of New Entrants
- 4.7.2 Bargaining Power of Buyers
- 4.7.3 Bargaining Power of Suppliers
- 4.7.4 Threat of Substitutes
- 4.7.5 Competitive Rivalry
5 Market Size & Growth Forecasts
- 5.1 By Product Type
- 5.1.1 Stand-alone Washing Machines
- 5.1.2 Stand-alone Drying Machines / Dryers
- 5.1.3 Combined Washer-Dryers
- 5.2 By Loading Type
- 5.2.1 Front-Load
- 5.2.2 Top-Load
- 5.3 By Capacity
- 5.3.1 Below 6 Kg
- 5.3.2 6 - 8 Kg
- 5.3.3 Above 8 Kg
- 5.4 By Usage
- 5.4.1 Residential
- 5.4.2 Commercial (laundromats, hospitals, hotels, hostels, etc.)
- 5.5 By Distribution Channel
- 5.5.1 B2B / Direct from Manufacturers
- 5.5.2 B2C / Retail Consumers
- 5.6 By Geography
- 5.6.1 Northeast
- 5.6.2 Midwest
- 5.6.3 South
- 5.6.4 West
6 Competitive Landscape
- 6.1 Market Concentration
- 6.2 Strategic Moves
- 6.3 Market Share Analysis
- 6.4 Company Profiles (includes Global level Overview, Market level overview, Core Segments, Financials as available, Strategic Information, Market Rank/Share for key companies, Products & Services, and Recent Developments)
- 6.4.1 Whirlpool Corporation
- 6.4.2 LG Electronics USA
- 6.4.3 Samsung Electronics America
- 6.4.4 GE Appliances (a Haier company)
- 6.4.5 Electrolux (North America)
- 6.4.6 Bosch Home Appliances
- 6.4.7 Miele USA
- 6.4.8 Alliance Laundry Systems (Speed Queen, Huebsch)
- 6.4.9 Maytag (Whirlpool brand)
- 6.4.10 Amana (Whirlpool brand)
- 6.4.11 Kenmore (Transform co.)
- 6.4.12 Haier America
- 6.4.13 Panasonic North America
- 6.4.14 Fisher & Paykel Appliances
- 6.4.15 Danby Appliances
- 6.4.16 Hisense USA
- 6.4.17 Speed Queen Commercial
- 6.4.18 Dexter Laundry
- 6.4.19 Continental Girbau
- 6.4.20 Girbau North America
7 Market Opportunities & Future Outlook
- 7.1 Subscription-based "Appliance-as-a-Service" for urban millennials
- 7.2 Retrofit IoT modules to upgrade installed base for energy optimization

