
PUBLISHER: Mordor Intelligence | PRODUCT CODE: 1940766

PUBLISHER: Mordor Intelligence | PRODUCT CODE: 1940766
United States Less Than-Truck-Load (LTL) - Market Share Analysis, Industry Trends & Statistics, Growth Forecasts (2026 - 2031)
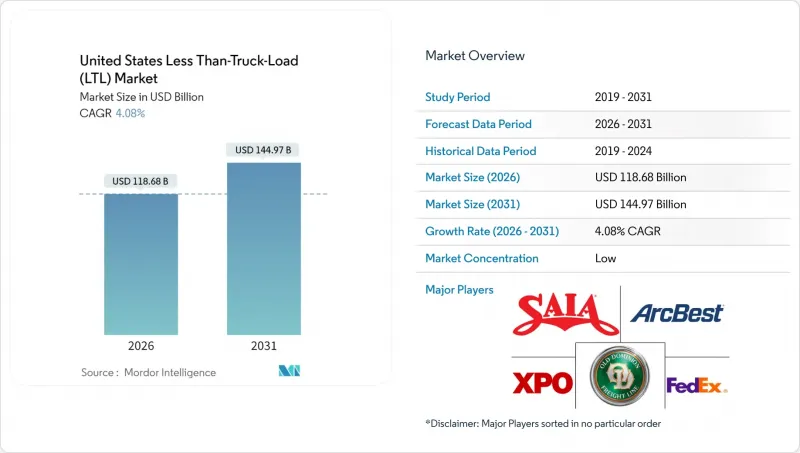
The United States Less than-Truck-Load market size in 2026 is estimated at USD 118.68 billion, growing from 2025 value of USD 114.03 billion with 2031 projections showing USD 144.97 billion, growing at 4.08% CAGR over 2026-2031.
E-commerce fulfillment, reshoring of domestic manufacturing, and omnichannel retail strategies are re-shaping shipment profiles, while capacity constraints in tier-1 metropolitan terminals have elevated average warehouse lease rates above USD 8 per square foot in markets such as Los Angeles and New Jersey. Rising labor costs linked to driver shortages, energy price volatility, and heightened consolidation following Yellow Corporation's 2023 exit are intensifying competitive dynamics and encouraging regional carriers to acquire terminals released by the bankruptcy estate. Investments authorized under the Infrastructure Investment and Jobs Act (IIJA) are earmarked for truck-only lanes and port upgrades that will enhance network fluidity, yet near-term service reliability remains sensitive to East and Gulf Coast labor disruptions that periodically reroute freight flows. Collectively, these factors reinforce the resilience of the United States Less than-Truck-Load market as shippers favor mode flexibility, granular visibility, and technology-enabled pricing models.
United States Less Than-Truck-Load (LTL) Market Trends and Insights
E-commerce Fulfillment Growth
United States retail e-commerce sales surpassed USD 1 trillion in 2024, prompting retailers to position inventory within one- to two-day ground zones around dense population centers. This geographic dispersion increases the frequency of medium-weight shipments unsuitable for parcel networks, thereby enlarging the addressable base of the United States Less than-Truck-Load market. Carriers such as PITT OHIO apply artificial-intelligence-driven route optimization to reduce labor costs by 25% and sharpen service windows. Residential deliveries of furniture, appliances, and office equipment yield higher margins when carried through specialized LTL final-mile services, encouraging ongoing investment in lift-gate equipment and white-glove capabilities. Cross-border e-commerce related to nearshoring further lifts volumes as Mexican-origin goods flow north into metropolitan delivery zones. As retailers seek consistent two-day performance at competitive rates, the United States Less than-Truck-Load market will remain integral to omnichannel fulfillment strategies across 2025-2030.
Reshoring-Led Domestic Manufacturing Rebound
Federal industrial incentives exceeding USD 910 billion stimulate the onshoring of automotive, aerospace, medical device, and electronics production, concentrating activity along the Interstate 35 corridor and similar arteries. Mexico ascended to the United States' top trading partner position in 2024, raising cross-border truck traffic that benefits LTL carriers adept at customs documentation and border drayage. Averitt's 85,000 ft2 San Antonio expansion featuring 80 cross-dock doors typifies asset deployment aimed at capturing this surge. Predictable component flows from nearshore plants allow density gains, translating into superior network economics and pricing leverage for carriers with strategically located terminals. The United States Less than-Truck-Load market consequently deepens its role in regionalized supply chains designed for resilience against trans-Pacific disruptions.
Driver Shortage and Aging Workforce
Drug and Alcohol Clearinghouse enforcement could remove up to 177,000 drivers, reducing the effective labor pool even as nearly one-third of current operators are near retirement age. Carriers counter by hiking pay-Averitt lifted hazmat driver rates from USD 0.60 to USD 0.64 per mile in 2025-and by channeling 20% of profits into employee retirement accounts to boost retention. Yet wage escalation inflates operating ratios, compelling carriers to refine linehaul planning, increase load factors, and introduce driver-assisting technology such as lane-keeping systems to lengthen career longevity. Persistent recruitment hurdles continue to weigh on the United States Less than-Truck-Load market growth trajectory despite healthy freight fundamentals.
Other drivers and restraints analyzed in the detailed report include:
- Omnichannel Retail Network Optimization
- Urban Retail Real-Estate Repurposed into Cross-Dock Micro-Hubs
- Acute Terminal-Capacity Constraints in Tier-1 Metros
For complete list of drivers and restraints, kindly check the Table Of Contents.
Segment Analysis
Wholesale and Retail Trade accounted for 34.56% of the United States less than-truck-load market size in 2025 and is advancing at a 5.13% CAGR between 2026-2031, outpacing every other vertical as retailers recalibrate inventory closer to consumption points. Manufacturing remains the second-largest contributor, buoyed by nearshoring that channels components northbound through inland hubs. Construction, Agriculture, and Energy add variability across seasons, yet together strengthen lane density in secondary markets where capacity would otherwise be imbalanced.
Retail fulfillment's requirement for rapid restocking of micro-fulfillment and dark-store formats means medium-weight loads ride LTL more often than truckload or parcel. AI-enhanced demand sensing has trimmed inventory carrying costs for large chains, yet it raises shipment frequency, a factor that ultimately expands the United States Less than-Truck-Load market. Manufacturing traffic, especially auto parts and machinery, keeps south-to-north routes balanced, reducing empty miles and undergirding network economics. The United States Less than-Truck-Load industry thus maintains a stable revenue mix, mitigating sector cyclicality through vertical diversification.
The United States Less Than-Truck-Load (LTL) Market Report is Segmented by End User Industry (Agriculture, Fishing, and Forestry, Construction, Manufacturing, Oil and Gas, Mining and Quarrying, Wholesale and Retail Trade, and Others), and Destination (Domestic and International). The Market Forecasts are Provided in Terms of Value (USD).
List of Companies Covered in this Report:
- A. Duie Pyle, Inc.
- ArcBest
- Averitt Express, Inc.
- C.H. Robinson
- Day & Ross
- Daylight Transport, LLC
- Dayton Freight Lines, Inc.
- DHL Group
- Estes Express Lines
- Fastfrate Inc.
- FedEx
- Knight-Swift Transportation Holdings Inc.
- Landstar System Inc.
- Oak Harbor Freight Lines, Inc.
- Old Dominion Freight Line
- Pitt Ohio Transportation Group
- R+L Carriers, Inc.
- Roadrunner Freight
- Saia Inc.
- Schneider National, Inc.
- Southeastern Freight Lines
- TFI International Inc.
- United Parcel Service of America, Inc. (UPS)
- Ward Transport and Logistics Corporation
- Werner Enterprises Inc.
- XPO, Inc.
Additional Benefits:
- The market estimate (ME) sheet in Excel format
- 3 months of analyst support
TABLE OF CONTENTS
1 Introduction
- 1.1 Study Assumptions and Market Definition
- 1.2 Scope of the Study
2 Research Methodology
3 Executive Summary
4 Market Landscape
- 4.1 Market Overview
- 4.2 GDP Distribution by Economic Activity
- 4.3 GDP Growth by Economic Activity
- 4.4 Economic Performance and Profile
- 4.4.1 Trends in E-Commerce Industry
- 4.4.2 Trends in Manufacturing Industry
- 4.5 Transport and Storage Sector GDP
- 4.6 Logistics Performance
- 4.7 Length of Roads
- 4.8 Export Trends
- 4.9 Import Trends
- 4.10 Fuel Pricing Trends
- 4.11 Trucking Operational Costs
- 4.12 Trucking Fleet Size by Type
- 4.13 Major Truck Suppliers
- 4.14 Road Freight Tonnage Trends
- 4.15 Road Freight Pricing Trends
- 4.16 Modal Share
- 4.17 Inflation
- 4.18 Regulatory Framework
- 4.19 Value Chain and Distribution Channel Analysis
- 4.20 Market Drivers
- 4.20.1 E-Commerce Fulfilment Growth
- 4.20.2 Reshoring-Led Domestic Manufacturing Rebound
- 4.20.3 Omnichannel Retail Network Optimisation
- 4.20.4 Urban Retail Real-Estate Repurposed into Cross-Dock Micro-Hubs
- 4.20.5 API-Enabled Parcel-To-LTL Mode Shift For SMB Shippers
- 4.20.6 Truck-Only Lane Investments Under the IIJA Boosting LTL Transit Reliability
- 4.21 Market Restraints
- 4.21.1 Driver Shortage and Ageing Workforce
- 4.21.2 Diesel-Price Volatility
- 4.21.3 Acute Terminal-Capacity Constraints in Tier-1 Metros
- 4.21.4 Warehouse Labour Unionisation Ripple-Effects
- 4.22 Technology Innovations in the Market
- 4.23 Porter's Five Forces Analysis
- 4.23.1 Threat of New Entrants
- 4.23.2 Bargaining Power of Buyers
- 4.23.3 Bargaining Power of Suppliers
- 4.23.4 Threat of Substitutes
- 4.23.5 Competitive Rivalry
5 Market Size and Growth Forecasts (Value, USD)
- 5.1 End User Industry
- 5.1.1 Agriculture, Fishing, and Forestry
- 5.1.2 Construction
- 5.1.3 Manufacturing
- 5.1.4 Oil and Gas, Mining and Quarrying
- 5.1.5 Wholesale and Retail Trade
- 5.1.6 Others
- 5.2 Destination
- 5.2.1 Domestic
- 5.2.2 International
6 Competitive Landscape
- 6.1 Market Concentration
- 6.2 Key Strategic Moves
- 6.3 Market Share Analysis
- 6.4 Company Profiles (Includes Global Level Overview, Market Level Overview, Core Segments, Financials as Available, Strategic Information, Market Rank/Share for Key Companies, Products and Services, and Recent Developments)
- 6.4.1 A. Duie Pyle, Inc.
- 6.4.2 ArcBest
- 6.4.3 Averitt Express, Inc.
- 6.4.4 C.H. Robinson
- 6.4.5 Day & Ross
- 6.4.6 Daylight Transport, LLC
- 6.4.7 Dayton Freight Lines, Inc.
- 6.4.8 DHL Group
- 6.4.9 Estes Express Lines
- 6.4.10 Fastfrate Inc.
- 6.4.11 FedEx
- 6.4.12 Knight-Swift Transportation Holdings Inc.
- 6.4.13 Landstar System Inc.
- 6.4.14 Oak Harbor Freight Lines, Inc.
- 6.4.15 Old Dominion Freight Line
- 6.4.16 Pitt Ohio Transportation Group
- 6.4.17 R+L Carriers, Inc.
- 6.4.18 Roadrunner Freight
- 6.4.19 Saia Inc.
- 6.4.20 Schneider National, Inc.
- 6.4.21 Southeastern Freight Lines
- 6.4.22 TFI International Inc.
- 6.4.23 United Parcel Service of America, Inc. (UPS)
- 6.4.24 Ward Transport and Logistics Corporation
- 6.4.25 Werner Enterprises Inc.
- 6.4.26 XPO, Inc.
7 Market Opportunities and Future Outlook
- 7.1 White-Space and Unmet-Need Assessment

