
PUBLISHER: Mordor Intelligence | PRODUCT CODE: 1940839

PUBLISHER: Mordor Intelligence | PRODUCT CODE: 1940839
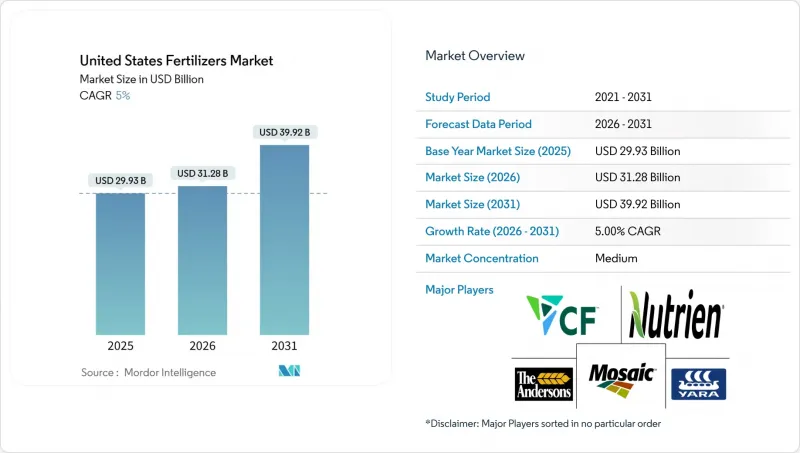
United States Fertilizers - Market Share Analysis, Industry Trends & Statistics, Growth Forecasts (2026 - 2031)
The United States fertilizers market is expected to grow from USD 29.92 billion in 2025 to USD 31.3 billion in 2026 and is forecast to reach USD 39.23 billion by 2031 at 4.62% CAGR over 2026-2031.
Strong demand for crop nutrients, growing adoption of precision agriculture, and policy incentives that reward enhanced-efficiency fertilizer use are sustaining revenue growth even as regulatory pressures tighten. Producers are investing in clean-ammonia capacity on the Gulf Coast to hedge natural gas volatility and meet emerging sustainability criteria. Meanwhile, intermodal logistics upgrades along the Mississippi River corridor are lowering delivered costs for Midwestern growers and helping the market absorb feedstock price shocks. Competitive intensity is rising as the five largest suppliers pursue vertical integration, expand digital agriculture platforms, and reposition portfolios toward specialty and controlled-release formulations.
United States Fertilizers Market Trends and Insights
Precision Agriculture Uptake
Variable-rate systems now guide fertilizer placement on 70% of corn and soybean acres, trimming nitrogen use by 15-20% while safeguarding yields . Adoption exceeds 85% in Iowa and Illinois, where satellite imagery, soil sensors, and yield mapping converge to deliver actionable prescriptions. Nutrien invests USD 200 million annually in digital agronomy platforms that integrate sensor data with product recommendations, a model that links advisory services to sales while improving nutrient use efficiency. As more growers verify savings and productivity gains, the technology is shifting purchasing decisions from volume to value, encouraging uptake of controlled-release products that match nutrient delivery to crop demand. Government Accountability Office modeling suggests industry-wide implementation could trim nationwide fertilizer use by as much as 12% without sacrificing output. This pivot toward data-driven management is therefore a structural growth lever for the United States fertilizers market.
Enhanced-Efficiency Fertilizers Shift
IRS Notice 2024-37 links a USD 1.75 per gallon sustainable aviation fuel credit to proof of enhanced-efficiency nitrogen use, creating an outsize pull for controlled-release urea, nitrification inhibitors, and urease inhibitors. Producers are scaling capacity in response; CF Industries earmarked USD 150 million to retrofit its Donaldsonville complex for controlled-release urea, while Bayer's Carbon Program has issued more than 125,000 credits tied to such products, confirming direct greenhouse-gas reductions on the farm. As carbon markets converge with tax policy, demand is migrating from niche horticulture into core commodity acreage, widening the customer base and accelerating top-line growth for suppliers of specialty formulations.
Natural Gas Price Volatility
Henry Hub prices oscillated between USD 2.10 and USD 6.80 per MMBtu in 2024, driving a 224% range that translates almost directly into nitrogen production costs because feedstock accounts for up to 80% of ammonia expenditure. CF Industries notes that every USD 1.00 swing moves annual margins by as much as USD 55 million. Small producers without hedged contracts curtailed output during the third quarter of 2024 when spot gas breached USD 6.00, tightening supply while curbing demand among price-sensitive growers. University of Illinois analysis indicates that sustained gas over USD 5.00 reduces application rates by up to 12% as farmers seek lower-cost alternatives. The volatility, therefore, acts as a near-term drag on total nutrient consumption.
Other drivers and restraints analyzed in the detailed report include:
- High Corn and Soybean Commodity Prices
- Regenerative Farming Carbon-Credit Programs
- Tighter Nutrient-Runoff Regulations
For complete list of drivers and restraints, kindly check the Table Of Contents.
Segment Analysis
Straight fertilizers captured 77.35% of 2025 revenue in the United States fertilizers market because their single-nutrient formulations align neatly with precision variable-rate prescriptions that target soil-specific deficiencies. The United States fertilizers market size for straight formulations is projected to expand at a 4.74% CAGR through 2031 as corn and soybean acreage remains robust. Corn plantings reached 94.1 million acres in 2024 and continue to rely on high nitrogen rates, driving stable demand. For complex fertilizers, their blanket nutrient ratios often fail to align with site-specific prescriptions, thereby limiting growth. Micronutrients such as zinc and boron are increasing by 15-20% annually, as grid soil sampling identifies yield-limiting deficiencies in intensive rotations. Secondary nutrient demand, especially sulfur, is rebounding because industrial sulfur deposition has fallen sharply since 1990, pushing many soils below sufficiency thresholds.
Field-level economics still favor straight nutrients for large operations because retailers can blend to precise formulas at the point of sale. However, smaller farms and areas with limited custom application services continue to use complex grades for convenience. The United States fertilizers market share for micronutrient additives is likely to rise as more states document widespread deficiencies. Targeted iron applications in Minnesota and North Dakota lifted soybean yields by up to 12 bushels per acre, demonstrating the return on investment. Producers are therefore packaging micronutrients with bulk NPK blends to capture emerging high-margin revenue streams. Straight products will keep commanding the largest share, yet supplementary nutrients will provide incremental growth.
Conventional granular and prilled fertilizers delivered 76.10% of sales in 2025 owing to established supply chains, low per-unit cost, and compatibility with existing spreader equipment. Nevertheless, specialty formulations are expanding at a 5.18% CAGR as growers increasingly weigh environmental compliance and nutrient use efficiency. Controlled-release fertilizers such as polymer-coated urea allow steady nitrogen availability that synchronizes with crop uptake, leading to an adoption growth of 25% in Corn Belt corn systems. The United States fertilizers market size for specialty forms is bolstered by liquid solutions that integrate with sprayer fleets for variable-rate placement. Water-soluble formulations command high premiums in greenhouse and hydroponic operations where precise nutrient dosing curbs waste and boosts quality.
EPA Worker Protection Standards favor products that limit dust and applicator exposure, nudging demand toward liquids and coated granules. Nutrien reported significant revenue growth in its specialty division in 2024, citing strong orders for controlled-release and liquid products used in precision agriculture. The growth trajectory is expected to accelerate because specialty blends qualify for carbon programs and tax rebates that require demonstrated increases in nutrient efficiency, positioning them as multipurpose solutions in a tightening regulatory environment.
The United States Fertilizers Market is Segmented by Type (Complex, Straight), Form (Conventional, Specialty), Application Mode (Fertigation, Foliar, Soil), and Crop Type (Field Crops, Horticultural Crops, Turf & Ornamental). The Market Forecasts are Provided in Terms of Value (USD) and Volume (Metric Tons).
List of Companies Covered in this Report:
- CF Industries Holdings, Inc.
- Nutrien Ltd.
- The Mosaic Company
- The Andersons Inc.
- Yara International ASA
- Haifa Group
- ICL Group Ltd
- Koch Industries Inc.
- Sociedad Quimica y Minera de Chile SA
- Wilbur-Ellis Company LLC (Wilbur-Ellis Holdings Inc.)
- Intrepid Potash Inc.
- Compass Minerals International Inc.
- J.R. Simplot Company
- Growmark Inc.
- CHS Inc.
Additional Benefits:
- The market estimate (ME) sheet in Excel format
- 3 months of analyst support
TABLE OF CONTENTS
1 INTRODUCTION
- 1.1 Study Assumptions and Market Definition
- 1.2 Scope of the Study
- 1.3 Research Methodology
2 REPORT OFFERS
3 EXECUTIVE SUMMARY & KEY FINDINGS
4 KEY INDUSTRY TRENDS
- 4.1 Acreage Of Major Crop Types
- 4.1.1 Field Crops
- 4.1.2 Horticultural Crops
- 4.2 Average Nutrient Application Rates
- 4.2.1 Micronutrients
- 4.2.1.1 Field Crops
- 4.2.1.2 Horticultural Crops
- 4.2.2 Primary Nutrients
- 4.2.2.1 Field Crops
- 4.2.2.2 Horticultural Crops
- 4.2.3 Secondary Macronutrients
- 4.2.3.1 Field Crops
- 4.2.3.2 Horticultural Crops
- 4.2.1 Micronutrients
- 4.3 Regulatory Framework
- 4.4 Value Chain & Distribution Channel Analysis
- 4.5 Market Drivers
- 4.5.1 Precision agriculture adoption and technology integration
- 4.5.2 Enhanced-efficiency fertilizer development and policy support
- 4.5.3 Commodity price impacts on farmer purchasing power
- 4.5.4 Regenerative farming and carbon-credit programs
- 4.5.5 Gulf Coast green-ammonia capacity build-out
- 4.5.6 Mississippi intermodal fertilizer corridors
- 4.6 Market Restraints
- 4.6.1 Natural gas price volatility effects on nitrogen costs
- 4.6.2 Tighter nutrient-runoff regulations
- 4.6.3 Biologic nutrition substitutes in specialty crops
- 4.6.4 Aging ammonia pipeline network risks
5 MARKET SIZE AND GROWTH FORECASTS (VALUE AND VOLUME)
- 5.1 Type
- 5.1.1 Complex
- 5.1.2 Straight
- 5.1.2.1 Micronutrients
- 5.1.2.1.1 Boron
- 5.1.2.1.2 Copper
- 5.1.2.1.3 Iron
- 5.1.2.1.4 Manganese
- 5.1.2.1.5 Molybdenum
- 5.1.2.1.6 Zinc
- 5.1.2.1.7 Others
- 5.1.2.2 Nitrogenous
- 5.1.2.2.1 Ammonium Nitrate
- 5.1.2.2.2 Anhydrous Ammonia
- 5.1.2.2.3 Urea
- 5.1.2.2.4 Others
- 5.1.2.3 Phosphatic
- 5.1.2.3.1 DAP
- 5.1.2.3.2 MAP
- 5.1.2.3.3 SSP
- 5.1.2.3.4 TSP
- 5.1.2.4 Potassic
- 5.1.2.4.1 MoP
- 5.1.2.4.2 SoP
- 5.1.2.4.3 Others
- 5.1.2.5 Secondary Macronutrients
- 5.1.2.5.1 Calcium
- 5.1.2.5.2 Magnesium
- 5.1.2.5.3 Sulfur
- 5.1.2.1 Micronutrients
- 5.2 Form
- 5.2.1 Conventional
- 5.2.2 Speciality
- 5.2.2.1 CRF
- 5.2.2.2 Liquid Fertilizer
- 5.2.2.3 SRF
- 5.2.2.4 Water Soluble
- 5.3 Application
- 5.3.1 Soil
- 5.3.2 Foliar
- 5.3.3 Fertigation
- 5.4 Crop Type
- 5.4.1 Field Crops
- 5.4.2 Horticultural Crops
- 5.4.3 Turf & Ornamental
6 COMPETITIVE LANDSCAPE
- 6.1 Key Strategic Moves
- 6.2 Market Share Analysis
- 6.3 Company Landscape
- 6.4 Company Profiles
- 6.4.1 CF Industries Holdings, Inc.
- 6.4.2 Nutrien Ltd.
- 6.4.3 The Mosaic Company
- 6.4.4 The Andersons Inc.
- 6.4.5 Yara International ASA
- 6.4.6 Haifa Group
- 6.4.7 ICL Group Ltd
- 6.4.8 Koch Industries Inc.
- 6.4.9 Sociedad Quimica y Minera de Chile SA
- 6.4.10 Wilbur-Ellis Company LLC (Wilbur-Ellis Holdings Inc.)
- 6.4.11 Intrepid Potash Inc.
- 6.4.12 Compass Minerals International Inc.
- 6.4.13 J.R. Simplot Company
- 6.4.14 Growmark Inc.
- 6.4.15 CHS Inc.
7 KEY STRATEGIC QUESTIONS FOR FERTILIZERS CEOS

