
PUBLISHER: Mordor Intelligence | PRODUCT CODE: 1940841

PUBLISHER: Mordor Intelligence | PRODUCT CODE: 1940841
Vietnam Fertilizers - Market Share Analysis, Industry Trends & Statistics, Growth Forecasts (2026 - 2031)
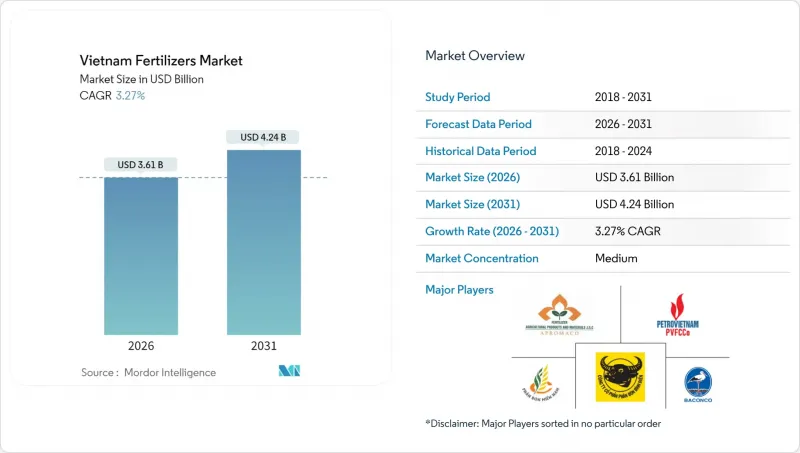
Vietnam fertilizers market size in 2026 is estimated at USD 3.61 billion, growing from 2025 value of USD 3.5 billion with 2031 projections showing USD 4.24 billion, growing at 3.27% CAGR over 2026-2031.
Vietnam benefits from surplus domestic urea, strong government modernization programs, and growing exports to Cambodia, South Korea, and the Philippines. Competitive pressure comes from logistics inflation and a new 5% VAT that changes cost dynamics, yet the tax credit mechanism ultimately favors local producers. Precision-fertigation systems and specialty fertilizer demand for high-value export crops are driving technology investment, while counterfeit imports and dependence on potash and DAP continue to weigh on margins. Meanwhile, aggressive capacity additions by domestic leaders and alliances with global distributors strengthen Vietnam's role as a regional fertilizer hub.
Vietnam Fertilizers Market Trends and Insights
Surplus Domestic Urea Driving Export Push
Vietnam produces a urea surplus of about 1.2 million metric tons annually, enabling 2024 exports of 1.73 million metric tons valued at USD 709.91 million, a 11.7% volume jump over 2023. Cambodia absorbed 34.3% of shipments, followed by South Korea at 12.7% and the Philippines at 6.3%. Cost advantages stem from integrated gas-based complexes in Phu My and Ca Mau that secure competitive feedstock pricing. The export momentum spreads freight risk and lifts plant utilization, thus buoying domestic earnings even when local demand moderates.
Pending 5% VAT Credit Lowers Local Production Cost
The implementation of 5% VAT credits in Vietnam's fertilizer market reduces production costs for domestic manufacturers, enhancing their competitiveness against imports. The transition from VAT exemption to a 5% VAT regime, effective July 1, 2025, enables producers to reclaim input VAT on natural gas and equipment. This tax adjustment decreases net production costs compared to imported fertilizers subject to full taxation. While the measure increases working capital requirements, it strengthens profit margins for domestic companies, particularly during peak seasons when diammonium phosphate (DAP) and potash import prices increase.
High Logistics Cost for Liquids and CRF to Remote Provinces
The high logistics costs associated with transporting liquid fertilizers and Controlled-Release Fertilizers (CRFs) to Vietnam's remote provinces constrain market growth. These costs increase final prices, reduce adoption rates, and restrict market penetration. Vietnam's logistics expenses constitute a significant portion of agricultural business revenue due to infrastructure limitations, supply chain inefficiencies, and dependence on international shipping. Transportation represents 60% of fertilizer logistics costs in Vietnam, compared to the global average of 30%. Ocean freight costs increased from USD 3,000 per container before the pandemic to USD 14,000 in 2024 . Additionally, road accessibility to the mountainous Northwest region remains restricted. The temperature-controlled shipping requirements for liquid and controlled-release fertilizers further increase delivery costs, limiting specialty fertilizer adoption beyond the delta regions.
Other drivers and restraints analyzed in the detailed report include:
- Precision-Fertigation Adoption in Mekong and Red River Deltas
- Government Organic Fertilizer Targets
- Potash and DAP Import Dependence - Exposed to Price Shocks
For complete list of drivers and restraints, kindly check the Table Of Contents.
Segment Analysis
Straight fertilizers captured 76.65% of the Vietnam fertilizers market share in 2025 and show the fastest growth of CAGR 3.42% by 2031, driven by cost-sensitive smallholder practices in rice, corn, and sugarcane production. Within this group, urea benefits from strong domestic production economics, whereas DAP and MAP remain import-dependent, adding price volatility. Complex fertilizers account for a smaller slice yet expand faster as plantation operators seek balanced NPK blends with sulfur and micronutrients.
Urea's accessibility underpins traditional broadcast application, but nitrogen losses through volatilization spur interest in inhibitors and coating technologies. Complex blends find traction with coffee and fruit growers targeting export-grade yields. Micronutrient formulations, though nascent, address zinc and boron deficiencies common in lateritic soils, lifting fruit quality premiums. Continued government education on nutrient stewardship is anticipated to shift volumes toward balanced formulas by decade-end.
Conventional granules dominated 94.85% of the Vietnamese fertilizers market in 2025, reflecting entrenched distribution networks and familiarity with broadcasting tools. Specialty forms posted a 3.58% CAGR through 2031 due to fertigation and greenhouse growth. Water-soluble crystals and liquid suspensions generate rapid uptake in drip-irrigated tropical fruit orchards, improving nutrient efficiency relative to granular top-dressing.
Controlled-release fertilizers command premium pricing and face steep freight costs to remote provinces, but large coffee estates accept higher outlays to cut labor costs. Microbial inoculants and humic-enriched liquids address soil health concerns and meet organic certification criteria. As digital platforms expand, specialty suppliers can serve niche demand efficiently, encouraging portfolio diversification among major producers.
The Vietnam Fertilizers Market is Segmented by Type (Complex and Straight), Form (Conventional and Specialty), Application Mode (Fertigation, Foliar, and Soil), and Crop Type (Field Crops, Horticultural Crops, and More). The Market Forecasts are Provided in Terms of Value (USD) and Volume (Metric Tons).
List of Companies Covered in this Report:
- PetroVietnam Fertilizer and Chemical Corporation
- PetroVietnam Ca Mau Fertilizer Joint Stock Company
- Baconco Company Limited
- Binh Dien Fertilizer Joint Stock Company
- Duc Giang Chemical Group Joint Stock Company
- Southern Fertilizer Joint Stock Company
- Ninh Binh Phosphate Fertilizer Joint Stock Company
- Agricultural Products and Materials Joint Stock Company
- Haifa Chemicals Ltd.
- Yara International ASA
- Grupa Azoty S.A.
- Lam Thao Fertilizers and Chemicals Joint Stock Company
- Song Gianh Corporation
- Que Lam Group Joint Stock Company
- Israel Chemicals Ltd.
- Nutrien Ltd.
Additional Benefits:
- The market estimate (ME) sheet in Excel format
- 3 months of analyst support
TABLE OF CONTENTS
1 INTRODUCTION
- 1.1 Study Assumptions & Market Definition
- 1.2 Scope of the Study
- 1.3 Research Methodology
2 REPORT OFFERS
3 EXECUTIVE SUMMARY & KEY FINDINGS
4 KEY INDUSTRY TRENDS
- 4.1 Acreage Of Major Crop Types
- 4.1.1 Field Crops
- 4.1.2 Horticultural Crops
- 4.2 Average Nutrient Application Rates
- 4.2.1 Micronutrients
- 4.2.1.1 Field Crops
- 4.2.1.2 Horticultural Crops
- 4.2.2 Primary Nutrients
- 4.2.2.1 Field Crops
- 4.2.2.2 Horticultural Crops
- 4.2.3 Secondary Macronutrients
- 4.2.3.1 Field Crops
- 4.2.3.2 Horticultural Crops
- 4.2.1 Micronutrients
- 4.3 Agricultural Land Equipped For Irrigation
- 4.4 Regulatory Framework
- 4.5 Value Chain & Distribution Channel Analysis
- 4.6 Market Drivers
- 4.6.1 Surplus domestic urea driving export push
- 4.6.2 Pending 5 % VAT credit lowers local production cost
- 4.6.3 Shift to specialty grades for high-value export crops
- 4.6.4 Precision-fertigation adoption in Mekong & Red River deltas
- 4.6.5 Government organic-fertilizer targets (50 % area by 2050)
- 4.6.6 E-commerce distribution platforms reaching smallholders
- 4.7 Market Restraints
- 4.7.1 High logistics cost for liquids & CRF to remote provinces
- 4.7.2 Counterfeit & sub-standard imports eroding farmer trust
- 4.7.3 Potash & DAP import dependence exposed to price shocks
- 4.7.4 Seasonal inventory glut depressing producer margins
5 MARKET SIZE AND GROWTH FORECASTS (VALUE AND VOLUME)
- 5.1 Type
- 5.1.1 Complex
- 5.1.2 Straight
- 5.1.2.1 Micronutrients
- 5.1.2.1.1 Boron
- 5.1.2.1.2 Copper
- 5.1.2.1.3 Iron
- 5.1.2.1.4 Manganese
- 5.1.2.1.5 Molybdenum
- 5.1.2.1.6 Zinc
- 5.1.2.1.7 Others
- 5.1.2.2 Nitrogenous
- 5.1.2.2.1 Urea
- 5.1.2.2.2 Others
- 5.1.2.3 Phosphatic
- 5.1.2.3.1 DAP
- 5.1.2.3.2 MAP
- 5.1.2.3.3 TSP
- 5.1.2.3.4 Others
- 5.1.2.4 Potassic
- 5.1.2.4.1 MoP
- 5.1.2.4.2 SoP
- 5.1.2.4.3 Others
- 5.1.2.5 Secondary Macronutrients
- 5.1.2.5.1 Calcium
- 5.1.2.5.2 Magnesium
- 5.1.2.5.3 Sulfur
- 5.1.2.1 Micronutrients
- 5.2 Form
- 5.2.1 Conventional
- 5.2.2 Speciality
- 5.2.2.1 CRF
- 5.2.2.2 Liquid Fertilizer
- 5.2.2.3 SRF
- 5.2.2.4 Water Soluble
- 5.3 Application Mode
- 5.3.1 Fertigation
- 5.3.2 Foliar
- 5.3.3 Soil
- 5.4 Crop Type
- 5.4.1 Field Crops
- 5.4.2 Horticultural Crops
- 5.4.3 Turf & Ornamental
6 COMPETITIVE LANDSCAPE
- 6.1 Key Strategic Moves
- 6.2 Market Share Analysis
- 6.3 Company Landscape
- 6.4 Company Profiles (Includes Global Level Overview, Market Level Overview, Core Business Segments, Financials, Headcount, Key Information, Market Rank, Market Share, Products and Services, and Analysis of Recent Developments)
- 6.4.1 PetroVietnam Fertilizer and Chemical Corporation
- 6.4.2 PetroVietnam Ca Mau Fertilizer Joint Stock Company
- 6.4.3 Baconco Company Limited
- 6.4.4 Binh Dien Fertilizer Joint Stock Company
- 6.4.5 Duc Giang Chemical Group Joint Stock Company
- 6.4.6 Southern Fertilizer Joint Stock Company
- 6.4.7 Ninh Binh Phosphate Fertilizer Joint Stock Company
- 6.4.8 Agricultural Products and Materials Joint Stock Company
- 6.4.9 Haifa Chemicals Ltd.
- 6.4.10 Yara International ASA
- 6.4.11 Grupa Azoty S.A.
- 6.4.12 Lam Thao Fertilizers and Chemicals Joint Stock Company
- 6.4.13 Song Gianh Corporation
- 6.4.14 Que Lam Group Joint Stock Company
- 6.4.15 Israel Chemicals Ltd.
- 6.4.16 Nutrien Ltd.
7 KEY STRATEGIC QUESTIONS FOR FERTILIZER CEOS

