
PUBLISHER: Mordor Intelligence | PRODUCT CODE: 1940843

PUBLISHER: Mordor Intelligence | PRODUCT CODE: 1940843
Australia And New Zealand Water Treatment Chemicals - Market Share Analysis, Industry Trends & Statistics, Growth Forecasts (2026 - 2031)
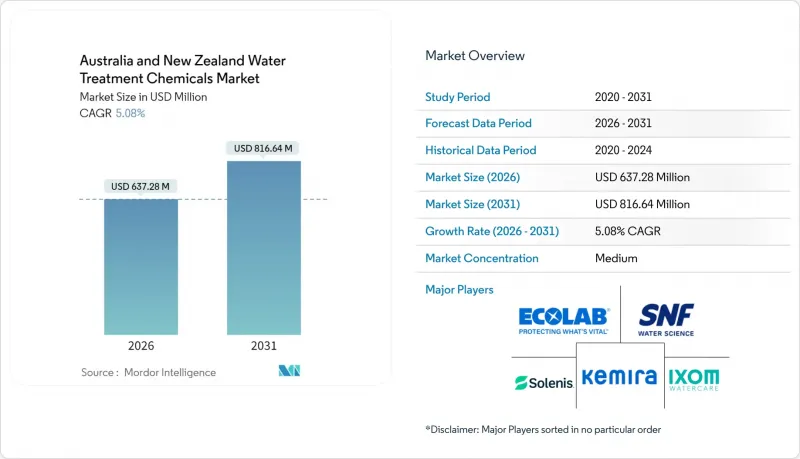
Australia and New Zealand water treatment chemicals market size in 2026 is estimated at USD 637.28 million, growing from 2025 value of USD 606.47 million with 2031 projections showing USD 816.64 million, growing at 5.08% CAGR over 2026-2031.
Growth in the water treatment chemicals market is driven by three synchronized forces: stricter ANZECC 2023 discharge licensing, increasing recycling mandates in mining and power, and the secondary effect of phosphate-free detergents, which lower influent phosphorus yet intensify tertiary nutrient-removal needs. Mining expansions in Western Australia and Queensland, coupled with urban infrastructure renewal in Sydney, Melbourne, and Auckland, are widening opportunities for coagulants, antiscalants, and corrosion inhibitors. Municipal utilities are embedding polyaluminum chloride into retrofits that integrate PFAS removal, while lithium, nickel, and geothermal projects are demanding tailored scale-control programs. Regional supply chains are moderately consolidated, as global majors leverage on-site technical services and digital dosing to deepen account stickiness; however, mid-tier suppliers with proximity advantages remain competitive.
Australia And New Zealand Water Treatment Chemicals Market Trends and Insights
Rising Groundwater and Surface-Water Pollution
Persistent nutrient loading and emerging contaminants are elevating chemical demand across both nations. In 2024, total phosphorus and chlorophyll-a in the Darling-Baaka River exceeded ANZECC thresholds by factors of 2-3, while Great Barrier Reef catchments saw worsening turbidity despite long-running best-management programs. PFAS has become a parallel crisis. New South Wales has identified more than 1,100 sites with detectable PFOS and PFOA. The 2025 Australian Drinking Water Guidelines have reduced the combined PFOS+PFHxS limit to 8 ng/L, requiring utilities to pair granular activated carbon and ion-exchange with upstream coagulation to prevent membrane fouling. Canterbury and Waikato aquifers are carrying rising nitrate and E. coli loads, prompting councils to mandate advanced oxidation and biological nutrient removal, both of which increase chemical dosage per megaliter treated. Each new contaminant class heightens formulation complexity and locks utilities into multi-year supply contracts with specialty chemical providers.
Growing Water-Intensive Industrial and Power Demand
Mining and energy capital spending is lifting baseline volumes in the water treatment chemicals market. Australian mining investment reached AUD 53 billion in 2024, with lithium, nickel, and copper projects generating hypersaline effluents that require phosphonate and polyacrylate scale inhibitors to prevent the precipitation of calcium sulfate and silica. Victoria's hydrogen roadmap projects 118 GL of ultrapure feedwater by 2050, achievable only through ion-exchange polishing and precise pH control. New Zealand geothermal plants in the Taupo Volcanic Zone combat silica scaling with antiscalant and electro-coagulation hybrids, extending maintenance intervals and chemical sales opportunities. As industrial water demand splits between high-volume, low-purity, and low-volume, ultra-high-purity needs, suppliers with diversified portfolios secure a competitive advantage.
Hazard Profile and Transport Restrictions for Hydrazine-Based Oxygen Scavengers
Hydrazine hydrate's Category 1B carcinogenic label triggers costly placarding, segregation, and driver certification under the Australian Dangerous Goods Code, adding up to 25% to delivered costs for remote power stations. Utilities are switching to carbohydrazide, erythorbate, and DEHA, as exemplified by AGL Energy's 2024 shift at Loy Yang A, which also resulted in lower insurance premiums. Retirements of coal units by 2030 will further shrink the high-pressure boiler base, which has historically consumed hydrazine, thereby constraining this portion of the water treatment chemicals market.
Other drivers and restraints analyzed in the detailed report include:
- Stricter Wastewater-Discharge Licensing Under ANZECC 2023
- Phosphate-Free Detergent Shift Boosting Coagulant Demand
- Rising Membrane-Based and UV Alternatives to Chemical Disinfection
For complete list of drivers and restraints, kindly check the Table Of Contents.
Segment Analysis
In 2025, coagulants and flocculants captured a 22.45% share of the water treatment chemicals market in Australia and New Zealand, emerging as the leading segment. This category is anticipated to grow at a 5.92% CAGR, surpassing the overall market growth rate. The municipal sector is a key driver, with facilities upgrading their processes to use polyaluminum chloride and ferric chloride, achieving effluent phosphorus levels below 0.5 mg/L. Meanwhile, the mining industry is contributing additional demand by employing high-molecular-weight polyacrylamide flocculants for tailings-water clarification, facilitating the efficient settling of fines in iron-ore, lithium, and copper processing circuits.
Secondary chemical classes grow at differentiated rates. Biocides and disinfectants face headwinds from the adoption of membranes, yet remain entrenched for controlling distribution residuals and cooling-tower biofilm. Scale inhibitors expand alongside desalination growth, with Perth's new Alkimos plant consuming phosphonate doses to prevent calcium sulfate scaling in 55% recovery RO trains. Corrosion inhibitors occupy niche but high-margin roles in geothermal condensate loops and food-grade systems. AS/NZS 4020 certification maintains a high compliance barrier that entrenches incumbent suppliers.
The Australia and New Zealand Water Treatment Chemicals Market Report is Segmented by Product Type (Biocides and Disinfectants, Coagulants and Flocculants, Corrosion Inhibitors, and More), End-User Industry (Power Generation, Oil and Gas, Chemical Manufacturing, Mining and Mineral Processing, Municipal, and More), and Geography (Australia and New Zealand). The Market Forecasts are Provided in Terms of Value (USD).
List of Companies Covered in this Report:
- Accepta Ltd
- Albemarle Corporation
- Aquasol
- Buckman
- Chemdrex Chemicals
- Coogee
- Dow
- Ecolab
- IWTS Group Pty Ltd
- Ixom
- Kemira Oyj
- SNF
- Solenis
- Solvay
- Veolia
Additional Benefits:
- The market estimate (ME) sheet in Excel format
- 3 months of analyst support
TABLE OF CONTENTS
1 Introduction
- 1.1 Study Assumptions and Market Definition
- 1.2 Scope of the Study
2 Research Methodology
3 Executive Summary
4 Market Landscape
- 4.1 Market Overview
- 4.2 Market Drivers
- 4.2.1 Rising groundwater and surface-water pollution
- 4.2.2 Growing water-intensive industrial and power demand
- 4.2.3 Stricter wastewater-discharge licensing under ANZECC 2023
- 4.2.4 Phosphate-free detergent shift boosting coagulant demand
- 4.2.5 Rapid adoption of onsite electro-oxidation pretreatment at mines
- 4.3 Market Restraints
- 4.3.1 Hazard profile and transport restrictions for hydrazine-based oxygen scavengers
- 4.3.2 Rising membrane-based and UV alternatives to chemical disinfection
- 4.3.3 Supply-chain exposure to Chinese glyphosate intermediates
- 4.4 Value Chain Analysis
- 4.5 Porter's Five Forces
- 4.5.1 Threat of New Entrants
- 4.5.2 Bargaining Power of Suppliers
- 4.5.3 Bargaining Power of Buyers
- 4.5.4 Threat of Substitutes
- 4.5.5 Degree of Competition
5 Market Size and Growth Forecasts (Value and Volume)
- 5.1 By Product Type
- 5.1.1 Biocides and Disinfectants
- 5.1.2 Coagulants and Flocculants
- 5.1.3 Corrosion Inhibitors
- 5.1.4 Scale Inhibitors and Antiscalants
- 5.1.5 Defoamers and Defoaming Agents
- 5.1.6 pH Adjuster and Softener
- 5.1.7 Other Product Types
- 5.2 By End-user Industry
- 5.2.1 Power Generation
- 5.2.2 Oil and Gas
- 5.2.3 Chemical Manufacturing
- 5.2.4 Mining and Mineral Processing
- 5.2.5 Municipal
- 5.2.6 Food and Beverage
- 5.2.7 Pulp and Paper
- 5.2.8 Other End-user Industries
- 5.3 By Geography
- 5.3.1 Australia
- 5.3.2 New Zealand
6 Competitive Landscape
- 6.1 Market Concentration
- 6.2 Strategic Moves
- 6.3 Market Share (%)/ Ranking Analysis
- 6.4 Company Profiles (includes Global level Overview, Market level overview, Core Segments, Financials as available, Strategic Information, Market Rank/Share, Products and Services, Recent Developments)
- 6.4.1 Accepta Ltd
- 6.4.2 Albemarle Corporation
- 6.4.3 Aquasol
- 6.4.4 Buckman
- 6.4.5 Chemdrex Chemicals
- 6.4.6 Coogee
- 6.4.7 Dow
- 6.4.8 Ecolab
- 6.4.9 IWTS Group Pty Ltd
- 6.4.10 Ixom
- 6.4.11 Kemira Oyj
- 6.4.12 SNF
- 6.4.13 Solenis
- 6.4.14 Solvay
- 6.4.15 Veolia
7 Market Opportunities and Future Outlook
- 7.1 White-space and Unmet-Need Assessment

