
PUBLISHER: Mordor Intelligence | PRODUCT CODE: 2035009

PUBLISHER: Mordor Intelligence | PRODUCT CODE: 2035009
Observability - Market Share Analysis, Industry Trends & Statistics, Growth Forecasts (2026 - 2031)
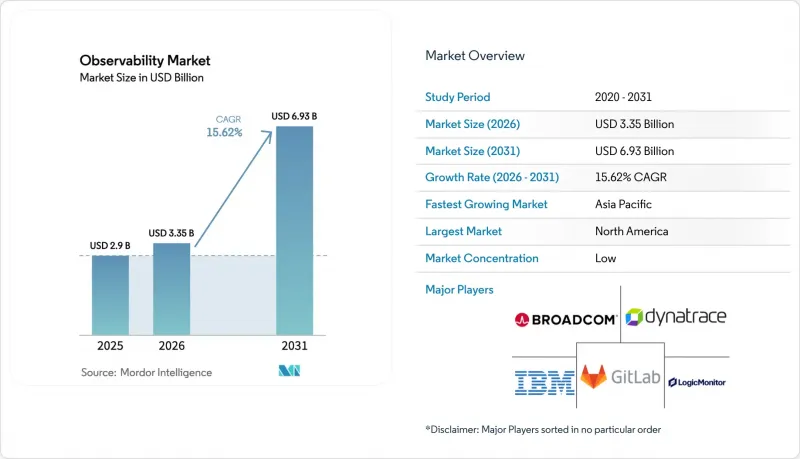
The observability market size was valued at USD 2.9 billion in 2025 and estimated to grow from USD 3.35 billion in 2026 to reach USD 6.93 billion by 2031, at a CAGR of 15.62% during the forecast period (2026-2031).
Enterprises are shifting from reactive monitoring toward proactive observability to manage cloud-native, AI-driven, and edge-centric workloads, and three technology waves generative AI, rapid cloud adoption, and edge computing stand out as the primary demand catalysts. Vendors that align platform roadmaps to these trends capture higher expansion revenue because buyers now value deep trace correlation, real-time AI model insights, and latency-aware analytics. Competitive intensity is rising as established APM leaders add AI observability while younger specialists position pricing around total telemetry costs. Finally, sustainability mandates are steering attention to sampling, intelligent routing, and carbon-aware data centers that complement baseline performance goals.
Global Observability Market Trends and Insights
AI-native instrumentation slashes MTTR
Up to 90% faster incident resolution is being recorded when automated root-cause analysis augments human investigations. Flip's DevOps-focused LLM shows how domain-trained agents cluster repetitive alerts and predict cascading failures before customer impact. Financial institutions such as Capital One embed AI telemetry to sharpen fraud detection, thereby translating engineering insights into regulatory compliance gains. These results encourage budget owners to position observability as a competitive differentiator, not a sunk operational cost. As the observability market evolves, vendors integrating agentic reasoning capabilities will obtain stickier contracts because customers prefer platforms that learn from live data and close incidents autonomously.
Shift to distributed, event-driven architectures
Microservices and serverless designs generate 50-100 times more telemetry than monoliths, overwhelming legacy monitoring back ends. Event streams, message queues, and asynchronous processing create blind spots that force enterprises to deploy OpenTelemetry-native correlation so every span aligns with a business transaction. E-commerce and banking rely on this visibility to protect revenue at peak loads, while manufacturers track IoT sensors and edge devices for predictive maintenance. High telemetry volumes drive interest in pipeline filtering tools that keep storage budgets under control. This architectural pivot secures a durable tailwind for the observability market because each new microservice typically adds more traces, logs, and metrics than the component it replaces.
Escalating observability data storage costs
Telemetry bills now exceed primary infrastructure spend for some enterprises, forcing buyers to deploy aggressive sampling and retention strategies. AWS CloudWatch users have realized up to 96.5% log cost savings through container insights optimization. FinOps teams created inside 90% of Fortune 50 firms track observability spend as a standalone KPI. Platform providers that couple ingestion with real-time filtering gain an edge in the observability market by turning cost control into a product feature.
Other drivers and restraints analyzed in the detailed report include:
- Cloud-first transformation budgets expand
- OpenTelemetry's standardisation unlocks vendor-agnostic growth
- Tool-chain sprawl and vendor lock-in risk
For complete list of drivers and restraints, kindly check the Table Of Contents.
Segment Analysis
The Services piece represented the fastest growth path with an 17.55% CAGR, whereas Solutions retained a 71.30% revenue share in 2025. This split underscores how enterprises need advisory and managed expertise that pairs with platform software to unlock full value. Integration teams design OpenTelemetry pipelines, optimize sampling, and align dashboards with business KPIs, enabling organizations to move beyond infrastructure monitoring into outcome-based analytics.
In practice, complex rollouts involve professional services for deployment, managed services for ongoing tuning, and consulting engagements that link SLA breaches to revenue risk. Demand spikes when AI observability is on the roadmap because in-house data scientists rarely own operational tooling skills. After service providers complete the build phase, customers often scale usage by activating additional modules, expanding the observability market size across post-implementation years.
Cloud/SaaS consumed 68.40% of spending in 2025, yet Hybrid is forecast for a 20.12% CAGR as regulators tighten residency rules and as edge nodes proliferate. The observability market size for Hybrid deployments advances because buyers want cloud elasticity combined with on-prem isolation for pii and trade secrets.
Financial services rollouts often centralize dashboards in the cloud but keep raw logs inside geo-fenced clusters, while manufacturing sites push observability to plant-floor edge gateways to avoid uplink congestion. Vendors that ship single control planes capable of running collectors in any environment satisfy these sovereignty requirements without duplicating tooling, and thereby accumulate incremental observability market share through upselling.
The Observability Market Report is Segmented by Component (Solution, and Services), Deployment (Cloud, On-Premises, and Hybrid), Enterprise Size (Small and Medium Enterprises {SMEs}, and Large Enterprises), End-User Vertical (IT and Telecom, BFSI, Retail and E-Commerce, Manufacturing, Healthcare and Lifesciences, Government and Defense, and More), and Geography. The Market Forecasts are Provided in Terms of Value (USD).
Geography Analysis
North America held 36.65% of spending in 2025, benefiting from early adoption curves, deep cloud penetration, and frameworks such as SOX and HIPAA that codify monitoring requirements. Financial firms instrument trade flows end-to-end to meet audit thresholds, while tech majors foster open-source ecosystems that accelerate community training. Growth remains steady as enterprises optimize existing stacks for AI workloads and edge extensions, sustaining sizeable demand within the observability market.
Asia-Pacific is projected to grow at a 19.62% CAGR, the fastest worldwide. Median annual outage costs reached USD 19.07 million, the highest globally, pushing executives to invest in proactive incident prevention. Governments prioritizing digital sovereignty often insist on hybrid deployments, which fuels demand for multi-tenant platforms that can localize data while preserving global dashboards. Telecommunications and advanced manufacturing plants in Japan, South Korea, and Singapore deploy 5G and Industry 4.0 stacks, generating rich telemetry that contributes materially to the observability market.
Europe grows steadily amid GDPR, the EU AI Act, and sustainability policies that motivate spend on privacy-aware and carbon-efficient telemetry pipelines. Enterprises often prefer hybrid topologies that keep sensitive datasets in-region. Vendors embedding data minimization, encryption at rest, and carbon calculators win bids, reinforcing the observability market's regulatory alignment narrative.
- Splunk Inc.
- Datadog Inc.
- Dynatrace LLC
- Cisco (AppDynamics)
- New Relic Inc.
- Microsoft (Azure Monitor)
- Amazon AWS CloudWatch
- Google Cloud Operations Suite
- Grafana Labs
- Elastic NV
- Honeycomb IO
- Sumo Logic
- SolarWinds
- PagerDuty
- ServiceNow (Lightstep)
- Broadcom (Elastic APM)
- ScienceLogic
- Riverbed Technology
- Gigamon
- Netscout Systems
- Keysight Technologies
Additional Benefits:
- The market estimate (ME) sheet in Excel format
- 3 months of analyst support
TABLE OF CONTENTS
1 INTRODUCTION
- 1.1 Study Assumptions and Market Definition
- 1.2 Scope of the Study
2 RESEARCH METHODOLOGY
3 EXECUTIVE SUMMARY
4 MARKET LANDSCAPE
- 4.1 Market Overview
- 4.2 Market Drivers
- 4.2.1 AI-native instrumentation slashes MTTR
- 4.2.2 Shift to distributed, event-driven architectures
- 4.2.3 Cloud-first transformation budgets expand
- 4.2.4 OpenTelemetry's standardization unlocks vendor-agnostic growth
- 4.2.5 Gen-AI demand for real-time model observability
- 4.2.6 Telco edge build-outs require low-latency full-stack visibility
- 4.3 Market Restraints
- 4.3.1 Escalating observability data storage costs
- 4.3.2 Tool-chain sprawl and vendor lock-in risk
- 4.3.3 Talent gap in observability engineering
- 4.3.4 Sustainability pressure to curb telemetry carbon footprint
- 4.4 Regulatory Landscape
- 4.5 Technological Outlook
- 4.6 Porter's Five Forces Analysis
- 4.6.1 Bargaining Power of Suppliers
- 4.6.2 Bargaining Power of Buyers
- 4.6.3 Threat of New Entrants
- 4.6.4 Threat of Substitutes
- 4.6.5 Competitive Rivalry
- 4.7 Impact of Macroeconomic Trends
5 MARKET SIZE AND GROWTH FORECASTS (VALUE)
- 5.1 By Component
- 5.1.1 Solutions
- 5.1.2 Services
- 5.2 By Deployment Mode
- 5.2.1 Cloud / SaaS
- 5.2.2 On-Premises
- 5.2.3 Hybrid
- 5.3 By Enterprise Size
- 5.3.1 Small and Medium Enterprises
- 5.3.2 Large Enterprises
- 5.4 By End-user Vertical
- 5.4.1 IT and Telecom
- 5.4.2 BFSI
- 5.4.3 Retail and E-commerce
- 5.4.4 Manufacturing
- 5.4.5 Healthcare and Life Sciences
- 5.4.6 Government and Defense
- 5.4.7 Other End-user Verticals
- 5.5 By Application
- 5.5.1 DevOps and APM
- 5.5.2 Infrastructure Monitoring
- 5.5.3 Security and Compliance
- 5.5.4 Data Observability
- 5.5.5 Business Analytics
- 5.6 By Region
- 5.6.1 North America
- 5.6.1.1 United States
- 5.6.1.2 Canada
- 5.6.1.3 Mexico
- 5.6.2 South America
- 5.6.2.1 Brazil
- 5.6.2.2 Argentina
- 5.6.2.3 Rest of South America
- 5.6.3 Europe
- 5.6.3.1 Germany
- 5.6.3.2 United Kingdom
- 5.6.3.3 France
- 5.6.3.4 Spain
- 5.6.3.5 Italy
- 5.6.3.6 Rest of Europe
- 5.6.4 Asia-Pacific
- 5.6.4.1 China
- 5.6.4.2 Japan
- 5.6.4.3 India
- 5.6.4.4 Australia
- 5.6.4.5 South Korea
- 5.6.4.6 Rest of Asia-Pacific
- 5.6.5 Middle East
- 5.6.5.1 Israel
- 5.6.5.2 Saudi Arabia
- 5.6.5.3 United Arab Emirates
- 5.6.5.4 Turkey
- 5.6.5.5 Rest of Middle East
- 5.6.6 Africa
- 5.6.6.1 South Africa
- 5.6.6.2 Egypt
- 5.6.6.3 Nigeria
- 5.6.6.4 Rest of Africa
- 5.6.1 North America
6 COMPETITIVE LANDSCAPE
- 6.1 Market Concentration
- 6.2 Strategic Moves
- 6.3 Market Share Analysis
- 6.4 Company Profiles (includes Global level Overview, Market level overview, Core Segments, Financials as available, Strategic Information, Market Rank/Share, Products and Services, Recent Developments)
- 6.4.1 Splunk Inc.
- 6.4.2 Datadog Inc.
- 6.4.3 Dynatrace LLC
- 6.4.4 Cisco (AppDynamics)
- 6.4.5 New Relic Inc.
- 6.4.6 Microsoft (Azure Monitor)
- 6.4.7 Amazon AWS CloudWatch
- 6.4.8 Google Cloud Operations Suite
- 6.4.9 Grafana Labs
- 6.4.10 Elastic NV
- 6.4.11 Honeycomb IO
- 6.4.12 Sumo Logic
- 6.4.13 SolarWinds
- 6.4.14 PagerDuty
- 6.4.15 ServiceNow (Lightstep)
- 6.4.16 Broadcom (Elastic APM)
- 6.4.17 ScienceLogic
- 6.4.18 Riverbed Technology
- 6.4.19 Gigamon
- 6.4.20 Netscout Systems
- 6.4.21 Keysight Technologies
7 MARKET OPPORTUNITIES AND FUTURE OUTLOOK
- 7.1 White-space and Unmet-needs Assessment

