
PUBLISHER: Mordor Intelligence | PRODUCT CODE: 2035044

PUBLISHER: Mordor Intelligence | PRODUCT CODE: 2035044
Freight And Logistics - Market Share Analysis, Industry Trends & Statistics, Growth Forecasts (2026 - 2031)
The Freight And Logistics Market size is expected to grow from USD 6.37 trillion in 2025 to USD 6.68 trillion in 2026 and is forecast to reach USD 8.49 trillion by 2031 at 4.91% CAGR over 2026-2031.
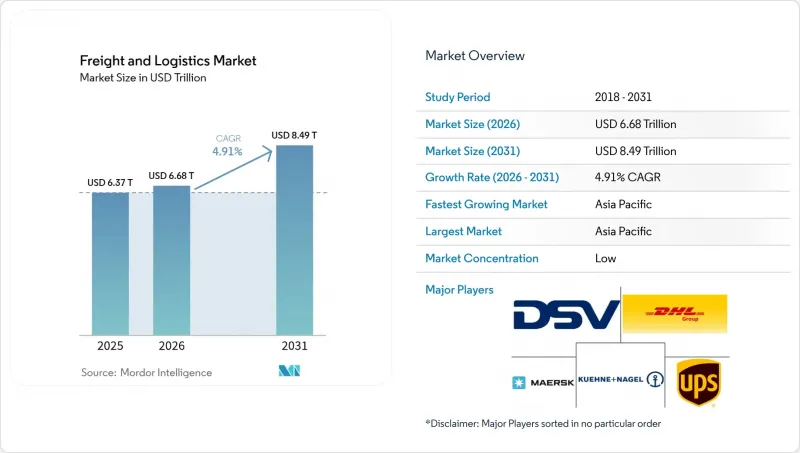
Robust e-commerce activity, infrastructure modernization, rising demand for cross-border courier, express, and parcel (CEP) services, and accelerating public-private partnerships keep the freight and logistics market on a steady growth path. Freight transport remains the backbone of global trade, yet segment diversification toward forwarding, warehousing, and last-mile fulfillment is increasing as shippers seek integrated solutions. Strong regional momentum in Asia-Pacific, regulatory pushes for Scope-3 emissions reporting, and technology investments in automation, visibility, and predictive optimization continue to reshape competitive strategies and cost structures. Consolidation, exemplified by DSV's purchase of DB Schenker, underscores the sector's focus on scale, network density, and technology leverage to offset capacity bottlenecks and driver shortages.
Global Freight And Logistics Market Trends and Insights
E-Commerce Penetration in Emerging Markets
Rising smartphone use and digital payment adoption in Asia-Pacific and Latin America amplify demand for rapid order fulfillment, forcing logistics providers to build micro-fulfillment facilities near high-density urban clusters. This structural shift boosts international CEP volumes, which command premium margins and require robust customs-clearing capabilities, harmonized product classification, and data-driven shipment visibility. Providers invest in automated sortation, artificial-intelligence-guided route planning, and omnichannel inventory orchestration to meet elevated consumer delivery promises. Regionally fragmented regulatory frameworks add complexity, prompting collaborative initiatives among customs authorities to streamline cross-border e-commerce compliance. As these efforts mature, cross-border parcel flows further integrate small and medium-sized sellers into global trade networks, expanding the overall freight and logistics market.
On-Demand Same-Day Delivery Expectations
In mature consumer markets, more than one-third of shoppers now prefer same-day delivery on key purchases, prompting retailers to reset fulfillment blueprints. Brick-and-mortar stores increasingly double as hyperlocal distribution nodes, shrinking last-mile distances and reducing per-parcel costs. Automated storage and retrieval systems, collaborative robots, and predictive labor scheduling enhance throughput in urban micro-warehouses. Last-mile specialists leverage crowdsourced couriers, dynamic routing software, and application programming interface (API) integrations that feed real-time order data into fleet management tools, ensuring delivery windows under two hours. High service expectations intensify margin pressure for traditional parcel operators yet create expansion avenues for tech-enabled entrants targeting dense cities across North America, Europe, and advanced Asia-Pacific markets.
Driver Shortage and Ageing Workforce
The median professional truck driver age in the United States and Western Europe exceeds 50 years, while pipeline talent lags due to lifestyle concerns and training backlogs. Rising wage bills elevate contract rates, inflate last-mile delivery costs, and limit surge capacity during peak seasons. To mitigate, carriers adopt telematics for optimized dispatching, deploy driver-assist technologies that cut fatigue, and pilot autonomous vehicle platoons on controlled corridors. Warehousing faces similar labor headwinds, encouraging investments in goods-to-person robotics and automated palletizing. Persistent personnel scarcity remains the single most pronounced brake on potential output gains within the freight and logistics market.
Other drivers and restraints analyzed in the detailed report include:
- Infrastructure Upgrades and PPP Logistics Corridors
- Reshoring and Near-Shoring of Manufacturing
- Port Congestion and Inland Bottlenecks
For complete list of drivers and restraints, kindly check the Table Of Contents.
Segment Analysis
Wholesale and retail trade accounted for 33.10% of the freight and logistics market size in 2025, driven by constant replenishment cycles, omnichannel fulfillment, and promotional seasonality. Inventory decentralization strategies require agile middle-mile transfers among regional distribution centers and store replenishment hubs. E-commerce surges magnify parcel density, challenging legacy hub-and-spoke topologies and stimulating investments in sortation automation and carrier diversification.
Manufacturing expands at the fastest 5.17% CAGR (2026-2031) as regionalization bolsters intra-continental raw material and component flows. Original equipment manufacturers mandate just-in-time sequencing, precise line-side deliveries, and real-time visibility to synchronize production across multi-plant footprints. Heavy-lift, project cargo, and temperature-controlled segments benefit from high-value machinery, electronics, and pharmaceutical demand, widening total addressable revenue within the freight and logistics market. Specialized logistics models, including vendor-managed inventory and supplier parks, gain traction, driving deeper integration between manufacturers and third-party logistics providers.
Freight transport generated 61.45% of the freight and logistics market size in 2025, underpinned by vast road, rail, sea, and air networks that physically move global commerce. Its mature footprint yields moderate expansion, projected at 4.19% CAGR between 2026-2031, as macro trade growth offsets efficiency gains. Forwarding, representing a 5.18% CAGR (2026-2031), leverages digital booking platforms, shipment visibility dashboards, and customs-brokerage expertise to orchestrate multimodal routing. Small and medium-sized exporters increasingly outsource compliance and carrier selection to forwarders, driving wallet-share capture within the freight and logistics market.
Providers integrate tariff classification engines, synchronized document workflows, and predictive arrival algorithms to shrink clearance times at borders. As global supply chains fragment across multiple origins, end-to-end orchestration and exception management become core differentiators, enabling forwarders to win contracts from shippers prioritizing agility over pure cost. Consequently, forwarding's share of the freight and logistics market steadily climbs, even as asset-heavy transport operations continue to dominate absolute revenue pools.
The Freight and Logistics Market Report is Segmented by End User Industry (Agriculture, Fishing, and Forestry, Construction, Wholesale and Retail Trade, and More), by Logistics Function (Courier, Express, and Parcel, Freight Forwarding, Freight Transport, Warehousing and Storage, and Other Services), and Geography (North America, Asia-Pacific, South America, and More). The Market Forecasts are Provided in Terms of Value (USD).
Geography Analysis
Asia-Pacific produced 41.20% of the freight and logistics market size in 2025 and posts the leading 6.15% CAGR between 2026-2031 as trade corridors diversify beyond China to Southeast Asia, India, and Oceania. Massive port expansions at Shanghai, Singapore, and Colombo, high-speed rail cargo lines on the China-Laos route, and digital single-window customs programs shrink transit times and lower compliance costs. Manufacturing shifts toward Vietnam, Indonesia, and the Philippines increase intra-Asian trucking, feeder vessel demand, and cross-border rail traffic.
Europe maintains a strong multimodal proposition, leveraging high-capacity rail freight corridors, short-sea shipping networks, and synchronized customs regimes inside the Schengen area. Sustainability leadership translates into early deployment of hydrogen trucks, electrified last-mile fleets, and modal shift incentives that reshape lane economics. Although geopolitical frictions with Russia complicate eastern overland routes, investments in Baltic and Mediterranean gateway ports foster alternative supply paths, preserving competitiveness within the freight and logistics market.
North America benefits from near-shoring to Mexico and Canada, driving cross-border tractor-trailer volumes and bilateral customs harmonization. The United States' Infrastructure Investment and Jobs Act accelerates highway rehabilitation, inland port development, and port dredging. Class I railroads expand intermodal terminals to capture e-commerce surge, while Gulf Coast port upgrades attract Asian blue-water services via the expanded Panama Canal. Collectively, these initiatives sustain mid-single-digit growth for the region's freight and logistics market.
- A.P. Moller-Maersk
- Allcargo Logistics
- Americold
- Aramex
- C.H. Robinson
- CJ Logistics Corporation
- CMA CGM Group (Including CEVA Logistics)
- CTS Logistics Group
- Culina Group
- DACHSER
- DHL Group
- DP World
- DSV A/S (Including DB Schenker)
- Expeditors International of Washington, Inc.
- FedEx
- GEODIS
- GXO Logistics
- Hellmann Worldwide Logistics
- Hub Group
- International Distributions Services
- J.B. Hunt Transport Services, Inc.
- Japan Post Holdings Co., Ltd.
- JD.com, Inc. (Including JD Logistics, Inc.)
- Kintetsu Group Holdings Co., Ltd. (Including Kintetsu World Express, Inc.)
- Kuehne+Nagel
- La Poste Group (Including DPD Group)
- Landstar System Inc.
- LOGWIN
- LX International Corp. (Including LX Pantos Co., Ltd.)
- Mainfreight
- NFI Industries
- NYK (Nippon Yusen Kaisha) Line
- Orient Overseas Container Line (OOCL Logistics)
- Penske Corporation (Including Penske Logistics)
- Poste Italiane
- Rhenus Logistics
- Ryder System, Inc.
- Savino Del Bene SpA
- SF Express (KEX-SF)
- Sinotrans, Ltd.
- The MSC Group (Mediterranean Shipping Company)
- Total Quality Logistics, LLC
- Uber Technologies Inc.
- United Parcel Service of America, Inc. (UPS)
- XPO, Inc.
- Yamato Holdings Co., Ltd.
Additional Benefits:
- The market estimate (ME) sheet in Excel format
- 3 months of analyst support
TABLE OF CONTENTS
1 Introduction
- 1.1 Study Assumptions and Market Definition
- 1.2 Scope of the Study
2 Research Methodology
3 Executive Summary
4 Market Landscape
- 4.1 Market Overview
- 4.2 Demographics
- 4.3 GDP Distribution by Economic Activity
- 4.4 GDP Growth by Economic Activity
- 4.5 Inflation
- 4.6 Economic Performance and Profile
- 4.6.1 Trends in E-Commerce Industry
- 4.6.2 Trends in Manufacturing Industry
- 4.7 Transport and Storage Sector GDP
- 4.8 Export Trends
- 4.9 Import Trends
- 4.10 Fuel Price
- 4.11 Trucking Operational Costs
- 4.12 Trucking Fleet Size by Type
- 4.13 Major Truck Suppliers
- 4.14 Logistics Performance
- 4.15 Modal Share
- 4.16 Maritime Fleet Load Carrying Capacity
- 4.17 Liner Shipping Connectivity
- 4.18 Port Calls and Performance
- 4.19 Freight Pricing Trends
- 4.20 Freight Tonnage Trends
- 4.21 Infrastructure
- 4.22 Regulatory Framework (Road and Rail)
- 4.22.1 Argentina
- 4.22.2 Australia
- 4.22.3 Brazil
- 4.22.4 Canada
- 4.22.5 Chile
- 4.22.6 China
- 4.22.7 Colombia
- 4.22.8 Egypt
- 4.22.9 France
- 4.22.10 Germany
- 4.22.11 India
- 4.22.12 Indonesia
- 4.22.13 Italy
- 4.22.14 Japan
- 4.22.15 Malaysia
- 4.22.16 Mexico
- 4.22.17 Netherlands
- 4.22.18 Nigeria
- 4.22.19 Nordics
- 4.22.20 Peru
- 4.22.21 Poland
- 4.22.22 Qatar
- 4.22.23 Romania
- 4.22.24 Russia
- 4.22.25 Saudi Arabia
- 4.22.26 South Africa
- 4.22.27 Spain
- 4.22.28 Thailand
- 4.22.29 Turkey
- 4.22.30 UAE
- 4.22.31 United Kingdom
- 4.22.32 United States
- 4.22.33 Uruguay
- 4.22.34 Vietnam
- 4.23 Regulatory Framework (Sea and Air)
- 4.23.1 Argentina
- 4.23.2 Australia
- 4.23.3 Brazil
- 4.23.4 Canada
- 4.23.5 Chile
- 4.23.6 China
- 4.23.7 Colombia
- 4.23.8 Egypt
- 4.23.9 France
- 4.23.10 Germany
- 4.23.11 India
- 4.23.12 Indonesia
- 4.23.13 Italy
- 4.23.14 Japan
- 4.23.15 Malaysia
- 4.23.16 Mexico
- 4.23.17 Netherlands
- 4.23.18 Nigeria
- 4.23.19 Nordics
- 4.23.20 Peru
- 4.23.21 Poland
- 4.23.22 Qatar
- 4.23.23 Romania
- 4.23.24 Russia
- 4.23.25 Saudi Arabia
- 4.23.26 South Africa
- 4.23.27 Spain
- 4.23.28 Thailand
- 4.23.29 Turkey
- 4.23.30 UAE
- 4.23.31 United Kingdom
- 4.23.32 United States
- 4.23.33 Uruguay
- 4.23.34 Vietnam
- 4.24 Value Chain and Distribution Channel Analysis
- 4.25 Market Drivers
- 4.25.1 E-Commerce Penetration in Emerging Markets
- 4.25.2 On-Demand Same-Day Delivery Expectations
- 4.25.3 Infrastructure Upgrades and PPP Logistics Corridors
- 4.25.4 Reshoring and Near-Shoring of Manufacturing
- 4.25.5 Mandatory Scope-3 Emissions Disclosure
- 4.25.6 Defense-Sector Stockpiling
- 4.26 Market Restraints
- 4.26.1 Driver Shortage and Ageing Workforce
- 4.26.2 Port Congestion and Inland Bottlenecks
- 4.26.3 Geopolitical Sanctions on Key Trade Lanes
- 4.26.4 High Cybersecurity Insurance Premiums
- 4.27 Technology Innovations in the Market
- 4.28 Porter's Five Forces Analysis
- 4.28.1 Threat of New Entrants
- 4.28.2 Bargaining Power of Buyers
- 4.28.3 Bargaining Power of Suppliers
- 4.28.4 Threat of Substitutes
- 4.28.5 Competitive Rivalry
5 Market Size and Growth Forecasts (Value, USD)
- 5.1 End User Industry
- 5.1.1 Agriculture, Fishing, and Forestry
- 5.1.2 Construction
- 5.1.3 Manufacturing
- 5.1.4 Oil and Gas, Mining and Quarrying
- 5.1.5 Wholesale and Retail Trade
- 5.1.6 Others
- 5.2 Logistics Function
- 5.2.1 Courier, Express, and Parcel (CEP)
- 5.2.1.1 By Destination Type
- 5.2.1.1.1 Domestic
- 5.2.1.1.2 International
- 5.2.1.1 By Destination Type
- 5.2.2 Freight Forwarding
- 5.2.2.1 By Mode of Transport
- 5.2.2.1.1 Air
- 5.2.2.1.2 Sea and Inland Waterways
- 5.2.2.1.3 Others
- 5.2.2.1 By Mode of Transport
- 5.2.3 Freight Transport
- 5.2.3.1 By Mode of Transport
- 5.2.3.1.1 Air
- 5.2.3.1.2 Pipelines
- 5.2.3.1.3 Rail
- 5.2.3.1.4 Road
- 5.2.3.1.5 Sea and Inland Waterways
- 5.2.3.1 By Mode of Transport
- 5.2.4 Warehousing and Storage
- 5.2.4.1 By Temperature Control
- 5.2.4.1.1 Non-Temperature Controlled
- 5.2.4.1.2 Temperature Controlled
- 5.2.4.1 By Temperature Control
- 5.2.5 Other Services
- 5.2.1 Courier, Express, and Parcel (CEP)
- 5.3 Region
- 5.3.1 Asia-Pacific
- 5.3.1.1 By Country
- 5.3.1.1.1 Australia
- 5.3.1.1.2 China
- 5.3.1.1.3 India
- 5.3.1.1.4 Indonesia
- 5.3.1.1.5 Japan
- 5.3.1.1.6 Malaysia
- 5.3.1.1.7 Thailand
- 5.3.1.1.8 Vietnam
- 5.3.1.1.9 Rest of Asia-Pacific
- 5.3.1.1 By Country
- 5.3.2 Europe
- 5.3.2.1 By Country
- 5.3.2.1.1 Denmark
- 5.3.2.1.2 Finland
- 5.3.2.1.3 France
- 5.3.2.1.4 Germany
- 5.3.2.1.5 Iceland
- 5.3.2.1.6 Italy
- 5.3.2.1.7 Netherlands
- 5.3.2.1.8 Norway
- 5.3.2.1.9 Poland
- 5.3.2.1.10 Romania
- 5.3.2.1.11 Russia
- 5.3.2.1.12 Spain
- 5.3.2.1.13 Sweden
- 5.3.2.1.14 Turkey
- 5.3.2.1.15 United Kingdom
- 5.3.2.1.16 Rest of Europe
- 5.3.2.1 By Country
- 5.3.3 Middle East and Africa
- 5.3.3.1 By Country
- 5.3.3.1.1 Egypt
- 5.3.3.1.2 Nigeria
- 5.3.3.1.3 Qatar
- 5.3.3.1.4 Saudi Arabia
- 5.3.3.1.5 South Africa
- 5.3.3.1.6 United Arab Emirates
- 5.3.3.1.7 Rest of Middle East and Africa
- 5.3.3.1 By Country
- 5.3.4 North America
- 5.3.4.1 By Country
- 5.3.4.1.1 Canada
- 5.3.4.1.2 Mexico
- 5.3.4.1.3 United States
- 5.3.4.1.4 Rest of North America
- 5.3.4.1 By Country
- 5.3.5 South America
- 5.3.5.1 By Country
- 5.3.5.1.1 Argentina
- 5.3.5.1.2 Brazil
- 5.3.5.1.3 Chile
- 5.3.5.1.4 Colombia
- 5.3.5.1.5 Peru
- 5.3.5.1.6 Uruguay
- 5.3.5.1.7 Rest of South America
- 5.3.5.1 By Country
- 5.3.6 Rest of the World
- 5.3.1 Asia-Pacific
6 Competitive Landscape
- 6.1 Market Concentration
- 6.2 Key Strategic Moves
- 6.3 Market Share Analysis
- 6.4 Company Profiles (Includes Global Level Overview, Market Level Overview, Core Segments, Financials as Available, Strategic Information, Market Rank/Share for Key Companies, Products and Services, and Recent Developments)
- 6.4.1 A.P. Moller-Maersk
- 6.4.2 Allcargo Logistics
- 6.4.3 Americold
- 6.4.4 Aramex
- 6.4.5 C.H. Robinson
- 6.4.6 CJ Logistics Corporation
- 6.4.7 CMA CGM Group (Including CEVA Logistics)
- 6.4.8 CTS Logistics Group
- 6.4.9 Culina Group
- 6.4.10 DACHSER
- 6.4.11 DHL Group
- 6.4.12 DP World
- 6.4.13 DSV A/S (Including DB Schenker)
- 6.4.14 Expeditors International of Washington, Inc.
- 6.4.15 FedEx
- 6.4.16 GEODIS
- 6.4.17 GXO Logistics
- 6.4.18 Hellmann Worldwide Logistics
- 6.4.19 Hub Group
- 6.4.20 International Distributions Services
- 6.4.21 J.B. Hunt Transport Services, Inc.
- 6.4.22 Japan Post Holdings Co., Ltd.
- 6.4.23 JD.com, Inc. (Including JD Logistics, Inc.)
- 6.4.24 Kintetsu Group Holdings Co., Ltd. (Including Kintetsu World Express, Inc.)
- 6.4.25 Kuehne+Nagel
- 6.4.26 La Poste Group (Including DPD Group)
- 6.4.27 Landstar System Inc.
- 6.4.28 LOGWIN
- 6.4.29 LX International Corp. (Including LX Pantos Co., Ltd.)
- 6.4.30 Mainfreight
- 6.4.31 NFI Industries
- 6.4.32 NYK (Nippon Yusen Kaisha) Line
- 6.4.33 Orient Overseas Container Line (OOCL Logistics)
- 6.4.34 Penske Corporation (Including Penske Logistics)
- 6.4.35 Poste Italiane
- 6.4.36 Rhenus Logistics
- 6.4.37 Ryder System, Inc.
- 6.4.38 Savino Del Bene SpA
- 6.4.39 SF Express (KEX-SF)
- 6.4.40 Sinotrans, Ltd.
- 6.4.41 The MSC Group (Mediterranean Shipping Company)
- 6.4.42 Total Quality Logistics, LLC
- 6.4.43 Uber Technologies Inc.
- 6.4.44 United Parcel Service of America, Inc. (UPS)
- 6.4.45 XPO, Inc.
- 6.4.46 Yamato Holdings Co., Ltd.
7 Market Opportunities and Future Outlook
- 7.1 White-space and Unmet-Need Assessment

