
PUBLISHER: Mordor Intelligence | PRODUCT CODE: 2035047

PUBLISHER: Mordor Intelligence | PRODUCT CODE: 2035047
Vietnam Pet Food - Market Share Analysis, Industry Trends & Statistics, Growth Forecasts (2026 - 2031)
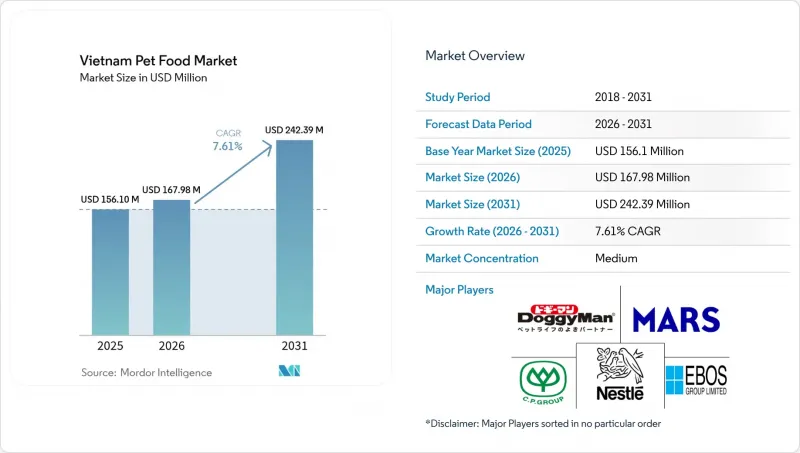
The Vietnam pet food market size in 2026 is estimated at USD 167.98 million, growing from 2025 value of USD 156.1 million with 2031 projections showing USD 242.39 million, growing at 7.61% CAGR over 2026-2031.
Robust urban income growth, widening pet ownership, and the appeal of functional nutrition anchor this expansion. Rising numbers of single-person households, social media-driven brand awareness, and a supportive e-commerce ecosystem are accelerating premium product uptake. Input-cost headwinds, evolving regulatory oversight, and pricing gaps between urban and rural buyers create near-term friction, yet integrated manufacturers with omnichannel reach continue to capture outsized gains. The Vietnam pet food market also benefits from government incentives encouraging local meat by-product use, helping domestic players manage volatility in imported proteins.
Vietnam Pet Food Market Trends and Insights
Rising Disposable Incomes of Pet Owners
In 2024, Vietnam's average monthly income per capita reached USD 213, reflecting a 9.1% increase compared to 2023. This growth rate surpassed the 6.2% increase observed between 2022 and 2023. Vietnamese pet owners allocate larger shares of discretionary budgets to pets, pushing premium segment penetration from 15% in 2022 to 23% in 2024. Imported functional diets can command 40-60% price premiums, yet remain accessible as income elasticity shows every 10% rise in disposable income lifts premium spending by 15%. Ho Chi Minh City and Hanoi buyers spend 3.2 times more per pet than rural counterparts, encouraging brand owners to layer portfolios with mid-tier and super-premium lines to capture broadening demand.
Humanization of Pets Boosting Functional Diets
Pets increasingly occupy family-member status, and owners seek products with probiotics, omega-3s, and organic components mirroring human food wellness trends. Nutraceutical products surged in 2024, as veterinary clinics logged more nutrition consultations. Influencers on Facebook and TikTok promote premium formulas to a combined 2.3 million followers, amplifying awareness. Positioning diets as long-term health investments rather than commodities supports margin expansion, particularly among millennials and Gen Z households. This shift is deepening category sophistication, with consumers prioritizing ingredient transparency, ethical sourcing, and functional claims such as immunity and gut health. As a result, brands that integrate science-backed nutrition with emotional marketing are capturing loyalty faster, reinforcing the premiumization wave driving growth in the Vietnam pet food market.
Price Sensitivity in Rural Provinces
Average rural income is 40% of city levels, so basic nutrition products dominate outside Tier-1 zones. High logistics costs in remote districts raise shelf prices by 15-20%, deterring premium adoption. Rural consumers spend significantly less on pet food compared to urban households, keeping the Vietnam pet food market's value heavily weighted toward cities. International brands relying on imports face the steepest hurdles due to weak rural purchasing power and fragmented distribution networks. Limited retailer reach and low awareness of nutritional differentiation further constrain premium category expansion beyond urban centers.
Other drivers and restraints analyzed in the detailed report include:
- Expansion of Specialty Retail Chains
- Government Incentives for Meat By-Product Use
- Plastic-Waste Regulations Driving Costs
For complete list of drivers and restraints, kindly check the Table Of Contents.
Segment Analysis
Traditional food secured 49.76% of sales in 2025, followed by treats, veterinary diets, and fast-climbing nutraceuticals. Nutraceuticals and supplements captured the smallest absolute slice but posted the strongest double-digit rise, signaling a decisive move toward scientifically positioned products. Dry formulas remain the day-to-day staple, thanks to affordable pricing and long shelf life, while wet offerings cater to palatability and portion control.
The fastest-growing nutraceuticals segment is projected to expand at an 11.62% CAGR, outpacing veterinary diets, treats, and food. The Vietnam pet food market size for functional products is fueled by 18% annual demand for probiotics and 22% growth in omega-3 enriched recipes. Stringent import testing under Circular 01/2024 encourages local R&D, helping Vietnamese firms add value and retain margins. Dental chews and freeze-dried treats also climb swiftly as owners link oral care and premium snacking with overall wellness.
The Vietnam Pet Food Market Report is Segmented Into Pet Food Product (Food, Pet Nutraceuticals/Supplements, Pet Treats, and Pet Veterinary Diets), Pets (Cats, Dogs, and Other Pets), and Distribution Channel (Convenience Stores, Online Channel, Specialty Stores, Supermarkets/Hypermarkets, and Other Channels). The Market Forecasts are Provided in Terms of Value (USD) and Volume (Metric Tons).
List of Companies Covered in this Report:
- EBOS Group Limited
- Mars, Incorporated
- Charoen Pokphand Group.
- Nestle (Purina)
- DoggyMan H.A.Co.,Ltd.
- VAFO PRAHA s.r.o.
- ADM
- Alltech
- Schell & Kampeter, Inc. (Diamond Pet Foods)
- Virbac
- Unicharm Corporation
- Spectrum Brands, Inc.,
- Inaba Foods (USA) Inc.
- Colgate-Palmolive Company (Hill's Pet Nutrition, Inc.)
- Thai Union Group PCL.
- Vinapet Investment & Development Joint Stock Company
Additional Benefits:
- The market estimate (ME) sheet in Excel format
- 3 months of analyst support
TABLE OF CONTENTS
1 INTRODUCTION
- 1.1 Study Assumptions & Market Definition
- 1.2 Scope of the Study
2 RESEARCH METHODOLOGY
3 EXECUTIVE SUMMARY
4 KEY INDUSTRY TRENDS
- 4.1 Pet Population
- 4.1.1 Cats
- 4.1.2 Dogs
- 4.1.3 Other Pets
- 4.2 Pet Expenditure
- 4.3 Consumer Trends
5 SUPPLY & PRODUCTION DYNAMICS
- 5.1 Trade Analysis
- 5.2 Ingredient Trends
- 5.3 Value Chain & Distribution Channel Analysis
- 5.4 Regulatory Framework
- 5.5 Market Drivers
- 5.5.1 Rising disposable incomes of pet owners
- 5.5.2 Humanization of pets boosting functional diets
- 5.5.3 Expansion of specialty retail chains
- 5.5.4 Growth of e-commerce and last-mile delivery
- 5.5.5 Government incentives for meat by-product use
- 5.5.6 Expatriate demand for imported grain-free diets
- 5.6 Market Restraints
- 5.6.1 Price sensitivity in rural provinces
- 5.6.2 Volatile supply of premium protein inputs
- 5.6.3 Plastic-waste regulations driving costs
- 5.6.4 Saturation of dog-food segment in Tier-1 cities
6 MARKET SIZE AND GROWTH FORECASTS (VALUE AND VOLUME)
- 6.1 Pet Food Product
- 6.1.1 Food
- 6.1.1.1 By Sub Product
- 6.1.1.1.1 Dry Pet Food
- 6.1.1.1.1.1 By Sub Dry Pet Food
- 6.1.1.1.1.1.1 Kibbles
- 6.1.1.1.1.1.2 Other Dry Pet Food
- 6.1.1.1.1.1 By Sub Dry Pet Food
- 6.1.1.1.2 Wet Pet Food
- 6.1.1.1.1 Dry Pet Food
- 6.1.1.1 By Sub Product
- 6.1.2 Pet Nutraceuticals/Supplements
- 6.1.2.1 By Sub Product
- 6.1.2.1.1 Milk Bioactives
- 6.1.2.1.2 Omega-3 Fatty Acids
- 6.1.2.1.3 Probiotics
- 6.1.2.1.4 Proteins and Peptides
- 6.1.2.1.5 Vitamins and Minerals
- 6.1.2.1.6 Other Nutraceuticals
- 6.1.2.1 By Sub Product
- 6.1.3 Pet Treats
- 6.1.3.1 By Sub Product
- 6.1.3.1.1 Crunchy Treats
- 6.1.3.1.2 Dental Treats
- 6.1.3.1.3 Freeze-dried and Jerky Treats
- 6.1.3.1.4 Soft and Chewy Treats
- 6.1.3.1.5 Other Treats
- 6.1.3.1 By Sub Product
- 6.1.4 Pet Veterinary Diets
- 6.1.4.1 By Sub Product
- 6.1.4.1.1 Derma Diets
- 6.1.4.1.2 Diabetes
- 6.1.4.1.3 Digestive Sensitivity
- 6.1.4.1.4 Obesity Diets
- 6.1.4.1.5 Oral Care Diets
- 6.1.4.1.6 Renal
- 6.1.4.1.7 Urinary Tract Disease
- 6.1.4.1.8 Other Veterinary Diets
- 6.1.4.1 By Sub Product
- 6.1.1 Food
- 6.2 Pets
- 6.2.1 Cats
- 6.2.2 Dogs
- 6.2.3 Other Pets
- 6.3 Distribution Channel
- 6.3.1 Convenience Stores
- 6.3.2 Online Channel
- 6.3.3 Specialty Stores
- 6.3.4 Supermarkets/Hypermarkets
- 6.3.5 Other Channels
7 COMPETITIVE LANDSCAPE
- 7.1 Key Strategic Moves
- 7.2 Market Share Analysis
- 7.3 Brand Positioning Matrix
- 7.4 Market Claim Analysis
- 7.5 Company Landscape
- 7.6 Company Profiles (Includes Global Level Overview, Market Level Overview, Core Business Segments, Financials, Key Information, Market Rank, Market Share, Products and Services, and Analysis of Recent Developments).
- 7.6.1 EBOS Group Limited
- 7.6.2 Mars, Incorporated
- 7.6.3 Charoen Pokphand Group.
- 7.6.4 Nestle (Purina)
- 7.6.5 DoggyMan H.A.Co.,Ltd.
- 7.6.6 VAFO PRAHA s.r.o.
- 7.6.7 ADM
- 7.6.8 Alltech
- 7.6.9 Schell & Kampeter, Inc. (Diamond Pet Foods)
- 7.6.10 Virbac
- 7.6.11 Unicharm Corporation
- 7.6.12 Spectrum Brands, Inc.,
- 7.6.13 Inaba Foods (USA) Inc.
- 7.6.14 Colgate-Palmolive Company (Hill's Pet Nutrition, Inc.)
- 7.6.15 Thai Union Group PCL.
- 7.6.16 Vinapet Investment & Development Joint Stock Company
8 KEY STRATEGIC QUESTIONS FOR PET FOOD CEOS

