
PUBLISHER: Mordor Intelligence | PRODUCT CODE: 2035158

PUBLISHER: Mordor Intelligence | PRODUCT CODE: 2035158
United States Data Center Cooling - Market Share Analysis, Industry Trends & Statistics, Growth Forecasts (2026 - 2031)
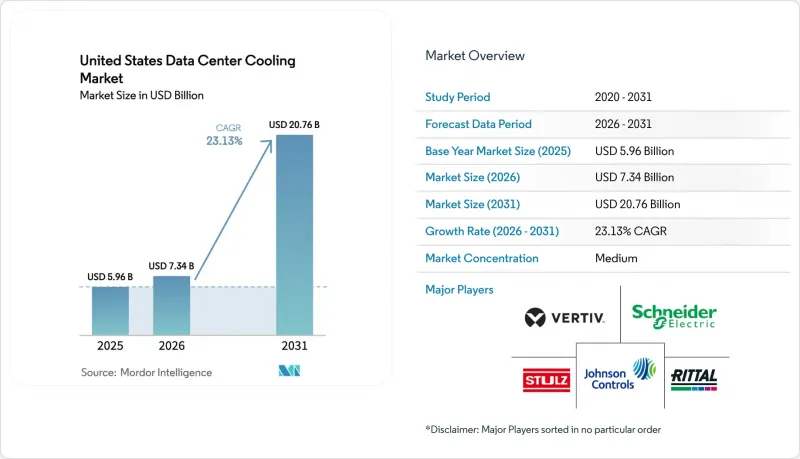
United States data center cooling market size in 2026 is estimated at USD 7.34 billion, growing from 2025 value of USD 5.96 billion with 2031 projections showing USD 20.76 billion, growing at 23.13% CAGR over 2026-2031.
Hyperscale operators are accelerating investments as AI workloads push rack densities beyond 50 kW, turning thermal performance into a design-limiting factor. Federal incentives under Section 179D, coupled with state rebates, lower upfront costs, and compressed payback periods, while corporate net-zero mandates shorten retrofit cycles to under a decade. Skills shortages in fluid handling and stricter water-use rules in Western states add cost and execution risk, yet also propel service revenues and drive innovation in water-neutral technologies. As a result, cooling now commands up to 35% of overall data-center capex, double its historical share.
United States Data Center Cooling Market Trends and Insights
Growing Hyperscale Build-outs Driven by AI and HPC Workloads
Exploding AI demand is propelling 50-100 kW rack densities, and hyperscalers are deploying production-scale liquid systems that can cost over USD 50,000 per rack. Microsoft rolled out immersion solutions across Azure regions as NVIDIA's Blackwell chips breach 1,000 W power envelopes. Immersion platforms yield up to 70% energy savings against CRAC units, freeing electrical capacity for compute growth. Northern Virginia, Texas, and California have become thermal-management clusters where contractor expertise commands premium pricing, reshaping regional cost curves.
Corporate-level Net-zero Commitments Accelerating Retrofit Cycles
Sustainability pledges from Meta, Google, and others shorten cooling refresh horizons to seven-ten years. DeepMind's AI-controlled chillers cut cooling energy up to 40% without hardware swaps.Yet retrofits risk multi-week outages; direct-to-chip upgrades on a 10 MW site can halt operations for two months, challenging 99.9% uptime targets. Prefabricated modules slash retrofit timelines by half, easing adoption hurdles.
Rising Capex for Liquid Infrastructure (Plumbing, Manifolds)
Direct-to-chip retrofits can cost USD 3,000-5,000 per kW, triple air systems, with manifolds alone at USD 15,000-25,000 per rack. Copper content is 3-4 X higher, exposing projects to commodity swings as global demand outpaces supply. Limited suppliers of PFAS-free fluids extend lead times, and labor rates vary up to 60% between primary and secondary metros.
Other drivers and restraints analyzed in the detailed report include:
- Federal Tax Incentives for Energy-efficient HVAC Equipment
- Edge-data-center Roll-outs in Tier-2 Metros
- Skills Shortage in Fluid-handling and Facilities Engineering
For complete list of drivers and restraints, kindly check the Table Of Contents.
Segment Analysis
Hyperscalers secured 47.02% of the United States data center cooling market share in 2025 and are expanding at 24.98% CAGR as they adopt unproven liquid technologies ahead of enterprises. The United States data center cooling market size attributed to hyperscale environments is therefore positioned to rise sharply through 2031. Microsoft's zero-water prototypes and Google's immersion pilots underscore this early-adopter dynamic.
Enterprise and edge sites represent smaller footprints but significant aggregate demand as AI inference workloads decentralize. Colocation facilities now market turnkey liquid services, spreading capex across tenants and using modular equipment to swap between 15 kW enterprise racks and 80 kW AI clusters on demand. Cooling capability has thus become a core differentiator in colocation RFPs.
Tier 3 held 67.12% revenue during 2025, yet Tier 4 is the fastest-growing slice at 24.61% CAGR through 2031 as banks and hospitals secure 2N redundancy for AI diagnostics. The United States data center cooling market size for Tier 4 facilities will therefore outpace all other tiers despite its smaller base. N+2 or 2N liquid plants double capex but ensure uptime against pump or manifold failure.
Tier 1-2 sites dominate edge deployments where manageability tops efficiency. As operators chase unmanned designs, predictive leak detection and self-healing controls are becoming standard. Regulators in some states are weighing mandatory liquid systems for racks beyond 30 kW regardless of tier, which could accelerate adoption.
United States Data Center Cooling Market is Segmented by Data Center Type (Hyperscalers (owned and Leased), Enterprise and Edge, Colocation), Tier Type (Tier 1 and 2, Tier 3, Tier 4), Cooling Technology (Air Based Cooling, Liquid Based Cooling), Component (Service, Equipment). The Market Forecasts are Provided in Terms of Value (USD).
List of Companies Covered in this Report:
- Vertiv Group Corp.
- Schneider Electric SE
- Stulz GmbH
- Johnson Controls International plc
- Rittal GmbH and Co. KG
- Mitsubishi Electric Corporation
- Asetek A/S
- Green Revolution Cooling Inc.
- Emerson Electric Co.
- Airedale International Air-Conditioning
- Delta Electronics Inc.
- Carrier Global Corp.
- CoolIT Systems Inc.
- Munters Group
- Trane Technologies plc
- Liebert (Vertiv brand)
- nVent Electric plc
- Alfa Laval AB
- Iceotope Technologies Ltd.
- Submer Technologies
- LiquidStack Inc.
- Chilldyne Inc.
- Fujitsu Ltd.
- Hewlett Packard Enterprise (Cray EX liquid)
- Huawei Technologies Co. Ltd.
Additional Benefits:
- The market estimate (ME) sheet in Excel format
- 3 months of analyst support
TABLE OF CONTENTS
1 INTRODUCTION
- 1.1 Study Assumptions and Market Definition
- 1.2 Scope of the Study
2 RESEARCH METHODOLOGY
3 EXECUTIVE SUMMARY
4 MARKET LANDSCAPE
- 4.1 Market Overview
- 4.2 Market Drivers
- 4.2.1 Growing hyperscale build-outs driven by AI and HPC workloads
- 4.2.2 Corporate-level net-zero commitments accelerating retrofit cycles
- 4.2.3 Federal tax incentives for energy-efficient HVAC equipment
- 4.2.4 Edge-data-center roll-outs in Tier-2 metros
- 4.2.5 Under-the-radar: Growing availability of secondary heat-reuse of datacenter waste heat
- 4.2.6 Under-the-radar: Pressure from insurance carriers to lower fire-risk drives switch to dielectric fluids
- 4.3 Market Restraints
- 4.3.1 Rising capex for liquid infrastructure (plumbing, manifolds)
- 4.3.2 Skills shortage in fluid-handling and facilities engineering
- 4.3.3 Environmental opposition to evaporative water use in drought-prone states
- 4.3.4 Under-the-radar: Supply-chain volatility of specialty coolants (PFAS-free fluids)
- 4.4 Supply-Chain Analysis
- 4.5 Regulatory Landscape
- 4.6 Technological Outlook
- 4.7 Porter's Five Forces
- 4.7.1 Threat of New Entrants
- 4.7.2 Bargaining Power of Buyers
- 4.7.3 Bargaining Power of Suppliers
- 4.7.4 Threat of Substitutes
- 4.7.5 Competitive Rivalry
- 4.8 Assesment of Macroeconomic Factors on the Market
5 MARKET SIZE and GROWTH FORECASTS (VALUE)
- 5.1 By Data Center Type
- 5.1.1 Hyperscalers (owned and Leased)
- 5.1.2 Enterprise and Edge
- 5.1.3 Colocation
- 5.2 By Tier Type
- 5.2.1 Tier 1 and 2
- 5.2.2 Tier 3
- 5.2.3 Tier 4
- 5.3 By Cooling Technology
- 5.3.1 Air-based Cooling
- 5.3.1.1 Chiller and Economizer (DX Systems)
- 5.3.1.2 CRAH
- 5.3.1.3 Cooling Tower (covers direct, indirect and two-stage cooling)
- 5.3.1.4 Others
- 5.3.2 Liquid-based Cooling
- 5.3.2.1 Immersion Cooling
- 5.3.2.2 Direct-to-Chip Cooling
- 5.3.2.3 Rear-Door Heat Exchanger
- 5.3.1 Air-based Cooling
- 5.4 By Component
- 5.4.1 By Service
- 5.4.1.1 Consulting and Training
- 5.4.1.2 Installation and Deployment
- 5.4.1.3 Maintenance and Support
- 5.4.2 By Equipment
- 5.4.1 By Service
6 COMPETITIVE LANDSCAPE
- 6.1 Market Concentration
- 6.2 Strategic Moves
- 6.3 Market Share Analysis
- 6.4 Company Profiles (includes Global-level Overview, Market-level Overview, Core Segments, Financials as available, Strategic Information, Market Rank/Share, Products and Services, Recent Developments)
- 6.4.1 Vertiv Group Corp.
- 6.4.2 Schneider Electric SE
- 6.4.3 Stulz GmbH
- 6.4.4 Johnson Controls International plc
- 6.4.5 Rittal GmbH and Co. KG
- 6.4.6 Mitsubishi Electric Corporation
- 6.4.7 Asetek A/S
- 6.4.8 Green Revolution Cooling Inc.
- 6.4.9 Emerson Electric Co.
- 6.4.10 Airedale International Air-Conditioning
- 6.4.11 Delta Electronics Inc.
- 6.4.12 Carrier Global Corp.
- 6.4.13 CoolIT Systems Inc.
- 6.4.14 Munters Group
- 6.4.15 Trane Technologies plc
- 6.4.16 Liebert (Vertiv brand)
- 6.4.17 nVent Electric plc
- 6.4.18 Alfa Laval AB
- 6.4.19 Iceotope Technologies Ltd.
- 6.4.20 Submer Technologies
- 6.4.21 LiquidStack Inc.
- 6.4.22 Chilldyne Inc.
- 6.4.23 Fujitsu Ltd.
- 6.4.24 Hewlett Packard Enterprise (Cray EX liquid)
- 6.4.25 Huawei Technologies Co. Ltd.
7 MARKET OPPORTUNITIES and FUTURE OUTLOOK
- 7.1 White-Space and Unmet-Need Assessment

