
PUBLISHER: Mordor Intelligence | PRODUCT CODE: 2044068

PUBLISHER: Mordor Intelligence | PRODUCT CODE: 2044068
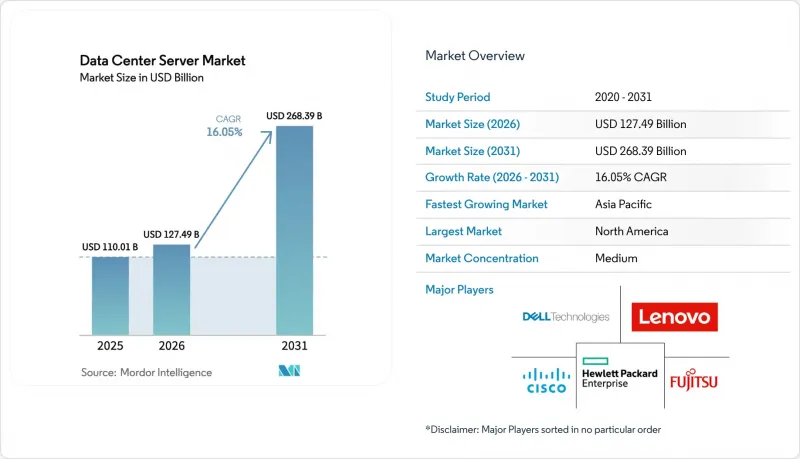
Data Center Server - Market Share Analysis, Industry Trends & Statistics, Growth Forecasts (2026 - 2031)
The Data Center Server Market size is expected to increase from USD 110.01 billion in 2025 to USD 127.49 billion in 2026 and reach USD 268.39 billion by 2031, growing at a CAGR of 16.05% over 2026-2031.
Escalating artificial-intelligence training runs, rapid edge buildouts, and the adoption of liquid cooling are shortening refresh cycles and underpinning robust demand. Sovereign-AI mandates in Europe and the Middle East are encouraging on-premises clusters, fragmenting the data center server market away from public-cloud concentration. Hyperscale operators are standardizing on GPU-dense racks that exceed 80 kilowatts, forcing OEMs to redesign chassis around direct-to-chip liquid cooling. Supply constraints for high-bandwidth memory are prompting hyperscalers to lock in multiyear component contracts, which, in turn, stabilize medium-term shipment visibility.
Global Data Center Server Market Trends and Insights
Proliferation of AI and ML Workloads Demanding GPU-Dense Servers
Training runs for large language models already involve clusters that exceed 10,000 NVIDIA H100 or AMD MI300X accelerators, elevating rack power to levels that conventional air-cooling cannot support. Meta plans to deploy 350,000 H100-equivalent GPUs by end-2026, translating into roughly 175 megawatts of incremental load in less than two years. Microsoft provisioned dedicated GPU clusters across multiple Azure regions to maintain sub-second inference latency for GPT-4 users, highlighting how latency targets now drive server location as strongly as cost. Older CPU-centric racks lack the memory bandwidth and NVLink fabric needed for multimodal training, which is compressing refresh cycles. Server vendors are therefore shipping liquid-cooled GPU trays as baseline configurations, halving lead times and aligning hardware with hyperscaler deployment schedules.
Hyperscale and Edge Data-Center Build-Out Momentum
Amazon Web Services committed USD 150 billion through 2030 for new capacity, signaling that compute-demand growth remains far from saturation. Google is erecting a 1-gigawatt campus in Saudi Arabia's NEOM zone that leverages seawater cooling to achieve sub-1.1 power-usage effectiveness, which could serve as a template for desert deployments. Verizon already operates 47 edge nodes across the United States to support 5G standalone cores, each housing up to 50 low-latency servers. Colocation leaders are retrofitting legacy halls with 30 kilowatt feeds to capture AI demand without forcing tenants to lease entire suites. The convergence of hyperscale and edge models is therefore blurring traditional tier classifications and reshaping procurement criteria.
Supply-Chain Volatility for Advanced Server Components
HBM production remains concentrated in SK Hynix and Micron, resulting in 40-week lead times for NVIDIA H200 servers and 52-week waits for Blackwell systems. SK Hynix raised HBM3e yields to 70%, yet capacity is fully booked until mid-2026. NVIDIA allocates chips to customers that pre-commit multi-year volumes, sidelining mid-tier providers lacking such scale. TSMC's CoWoS packaging lines are operating above 95% utilization with relief not expected until late 2026. As a result, AI-optimized servers carry 25%-30% premiums, eroding margins for colocation landlords bound by fixed-rate contracts.
Other drivers and restraints analyzed in the detailed report include:
- Liquid-Cooling-Ready Server Designs Enabling More than 80 kW Racks
- Adoption of Cloud-Computing Services
- Rising CapEx for Data-Center Construction
For complete list of drivers and restraints, kindly check the Table Of Contents.
Segment Analysis
Tier 3 sites dominated the data center server market, accounting for 56.72% of the market in 2025, as enterprises sought redundancy without the full cost of concurrent maintainability. Tier 4 adoption is accelerating at a 17.54% CAGR, driven by financial and healthcare firms confronting rising downtime penalties. The Uptime Institute noted that 23% of new projects in 2025 requested Tier 4 certification, up nine points from 2023. High-specification facilities integrate dual power supplies and independent cooling loops, adding USD 800-USD 1,200 per server but safeguarding against single-path failure. Tier 1 and Tier 2 environments persist at the edge, where brief outages are tolerable, and capex budgets remain tight.
A parallel architectural divergence is emerging as hyperscalers deploy custom resilience schemes that bypass traditional tier labels, routing workloads across zones in under 200 milliseconds. Basel Committee operational resilience guidelines are nudging banks toward Tier 3 minimums, indirectly influencing server procurement decisions. Colocation landlords are adopting modular UPS systems that scale capacity incrementally, aligning cash outflow with uncertain tenant growth.
Hyperscale campuses captured 58.94% of the market share in 2025, underscoring how AI training clusters favor footprints exceeding 500,000 square feet. The segment is tracking a 17.48% CAGR through 2031 as Meta and Microsoft commission gigawatt-scale parks. Large regional halls fill the gap for second-tier cloud providers, while medium facilities support mid-market colocation. Small edge sites, though numerous, contribute modestly to the data center server market size because they have limited server counts.
OEMs are reorganizing sales teams around hyperscale accounts that demand custom boards, proprietary firmware, and just-in-time logistics. Original design manufacturers such as Quanta and Wistron are exchanging margin for volume, delivering 50,000-unit quarters to cloud clients. Medium enterprises gravitate toward converged infrastructure that simplifies deployment but increases vendor lock-in. Edge operators favor rugged blades rated for industrial temperatures, a niche dominated by specialist suppliers.
The Data Center Server Market Report is Segmented by Tier Type (Tier 1 and 2, Tier 3, and Tier 4), Data Center Size (Small, Medium, Large, and Hyperscale), Data Center Type (Colocation, and More), Form Factor (Half-Height Blades, Full-Height Blades, and Quarter-height/Micro-blades), Application/Workload (Virtualization and Private Cloud, HPC, and More), and Geography. The Market Forecasts are Provided in Terms of Value (USD).
Geography Analysis
North America accounted for 39.83% of the market share in 2025, driven by hyperscale capital expenditure and early liquid-cooling deployments. The region benefits from mature power grids, abundant fiber, and tax incentives that offset rising land costs. Sovereign-cloud requirements are modest, so multitenant colocation remains attractive for enterprises seeking rapid capacity additions. However, permitting delays in Northern Virginia and California are lengthening construction timelines, nudging operators toward Midwest and Mountain-West alternatives with faster interconnection approvals.
Asia-Pacific is the fastest-growing region at an 18.01% CAGR through 2031. China is prioritizing domestic server vendors after export controls curtailed access to leading-edge GPUs, redirecting demand toward Inspur and Huawei platforms. India's production-linked incentive scheme is attracting Foxconn and Wistron assembly plants, reducing import duties and shortening lead times for local cloud providers. Japan clusters investments around Tokyo and Osaka due to cable proximity and resilient grids, while regional cities struggle with capacity caps.
Europe is stabilizing as renewable-energy mandates encourage hyperscalers to expand in the Nordics and Ireland where hydro and wind lower carbon intensity. Stringent water-usage regulations in Frankfurt and Amsterdam push developers toward closed-loop cooling and brownfield conversions. The Middle East and Africa are emerging corridors as Saudi Arabia and the United Arab Emirates pledge more than USD 50 billion for digital infrastructure that diversifies economies away from hydrocarbons. South America remains comparatively small, yet Brazil's data-protection law is stimulating local deployments to avoid cross-border data transfers. Africa's nascent server market concentrates in South Africa and Nigeria where diesel-solar hybrids mitigate unreliable grids, although total cost exceeds developed-market benchmarks by up to 40%.
- Dell Technologies
- Hewlett Packard Enterprise
- Lenovo Group Limited
- Fujitsu Limited
- Cisco Systems Inc.
- Kingston Technology Co. Inc.
- Huawei Technologies Co. Ltd.
- Inspur Group
- IBM Corporation
- Atos SE
- Super Micro Computer Inc.
- Quanta Cloud Technology
- ZT Systems
- Hon Hai / Foxconn Technology Group
- Advanced Micro Devices
- NVIDIA Corporation
- Oracle Corporation
- NEC Corporation
- Arista Networks
- Broadcom Inc.
Additional Benefits:
- The market estimate (ME) sheet in Excel format
- 3 months of analyst support
TABLE OF CONTENTS
1 INTRODUCTION
- 1.1 Study Assumptions and Market Definition
- 1.2 Scope of the Study
2 RESEARCH METHODOLOGY
3 EXECUTIVE SUMMARY
4 MARKET LANDSCAPE
- 4.1 Market Overview
- 4.2 Market Drivers
- 4.2.1 Adoption of Cloud Computing Services
- 4.2.2 Large-Scale Commercialization of 5G Networks
- 4.2.3 Hyperscale and Edge Data Center Build-Out Momentum
- 4.2.4 Proliferation of AI and ML Workloads Demanding GPU-Dense Servers
- 4.2.5 Liquid-Cooling-Ready Server Designs Enabling More than 80 kW Racks
- 4.2.6 Shift Toward ARM and RISC-V Architectures to Cut Total Cost of Ownership
- 4.3 Market Restraints
- 4.3.1 Rising CapEx for Data Center Construction
- 4.3.2 Escalating Cyber-Security and Ransomware Risks
- 4.3.3 Supply-Chain Volatility for Advanced Server Components (HBM, GPUs)
- 4.3.4 Power-Grid Constraints and Permitting Delays in Tier-1 Metros
- 4.4 Industry Supply-Chain Analysis
- 4.5 Regulatory Landscape
- 4.6 Technological Outlook
- 4.7 Porter's Five Forces Analysis
- 4.7.1 Threat of New Entrants
- 4.7.2 Bargaining Power of Buyers
- 4.7.3 Bargaining Power of Suppliers
- 4.7.4 Threat of Substitutes
- 4.7.5 Intensity of Competitive Rivalry
- 4.8 Assesment of Macroeconomic Factors on the Market
5 MARKET SIZE AND GROWTH FORECASTS (VALUE)
- 5.1 By Tier Type
- 5.1.1 Tier 1 and 2
- 5.1.2 Tier 3
- 5.1.3 Tier 4
- 5.2 By Data Center Size
- 5.2.1 Small Data Center
- 5.2.2 Medium Data Center
- 5.2.3 Large Data Center
- 5.2.4 Hyperscale Data Center
- 5.3 By Data Center Type
- 5.3.1 Colocation Data Center
- 5.3.2 Hyperscalers Data Center/CSPs
- 5.3.3 Enterprise and Edge Data Center
- 5.4 By Form Factor
- 5.4.1 Half-height Blades
- 5.4.2 Full-height Blades
- 5.4.3 Quarter-height / Micro-blades
- 5.5 By Application / Workload
- 5.5.1 Virtualisation and Private Cloud
- 5.5.2 High-Performance Computing (HPC)
- 5.5.3 Artificial Intelligence/Machine Learning and Data Analytics
- 5.5.4 Storage-centric
- 5.5.5 Edge / IoT Gateways
- 5.6 By Geography
- 5.6.1 North America
- 5.6.1.1 United States
- 5.6.1.2 Canada
- 5.6.1.3 Mexico
- 5.6.2 South America
- 5.6.2.1 Brazil
- 5.6.2.2 Argentina
- 5.6.2.3 Rest of South America
- 5.6.3 Europe
- 5.6.3.1 Germany
- 5.6.3.2 United Kingdom
- 5.6.3.3 France
- 5.6.3.4 Italy
- 5.6.3.5 Spain
- 5.6.3.6 Rest of Europe
- 5.6.4 Asia-Pacific
- 5.6.4.1 China
- 5.6.4.2 India
- 5.6.4.3 Japan
- 5.6.4.4 South Korea
- 5.6.4.5 Rest of Asia-Pacific
- 5.6.5 Middle East and Africa
- 5.6.5.1 Middle East
- 5.6.5.1.1 Saudi Arabia
- 5.6.5.1.2 United Arab Emirates
- 5.6.5.1.3 Rest of Middle East
- 5.6.5.2 Africa
- 5.6.5.2.1 South Africa
- 5.6.5.2.2 Nigeria
- 5.6.5.2.3 Rest of Africa
- 5.6.5.1 Middle East
- 5.6.1 North America
6 COMPETITIVE LANDSCAPE
- 6.1 Market Concentration
- 6.2 Strategic Moves
- 6.3 Market Share Analysis
- 6.4 Company Profiles (Includes Global Level Overview, Market Level Overview, Core Segments, Financials as Available, Strategic Information, Market Rank/Share, Products and Services, and Recent Developments)
- 6.4.1 Dell Technologies
- 6.4.2 Hewlett Packard Enterprise
- 6.4.3 Lenovo Group Limited
- 6.4.4 Fujitsu Limited
- 6.4.5 Cisco Systems Inc.
- 6.4.6 Kingston Technology Co. Inc.
- 6.4.7 Huawei Technologies Co. Ltd.
- 6.4.8 Inspur Group
- 6.4.9 IBM Corporation
- 6.4.10 Atos SE
- 6.4.11 Super Micro Computer Inc.
- 6.4.12 Quanta Cloud Technology
- 6.4.13 ZT Systems
- 6.4.14 Hon Hai / Foxconn Technology Group
- 6.4.15 Advanced Micro Devices
- 6.4.16 NVIDIA Corporation
- 6.4.17 Oracle Corporation
- 6.4.18 NEC Corporation
- 6.4.19 Arista Networks
- 6.4.20 Broadcom Inc.
7 MARKET OPPORTUNITIES AND FUTURE OUTLOOK
- 7.1 White-Space and Unmet-Need Assessment

