PUBLISHER: Mordor Intelligence | PRODUCT CODE: 2044079

PUBLISHER: Mordor Intelligence | PRODUCT CODE: 2044079
E-waste Management - Market Share Analysis, Industry Trends & Statistics, Growth Forecasts (2026 - 2031)
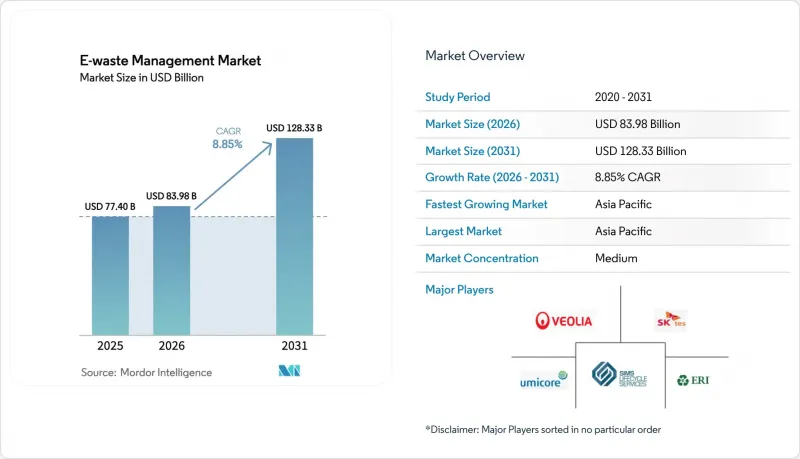
The E-waste Management Market size is expected to grow from USD 77.4 billion in 2025 to USD 83.98 billion in 2026 and is forecast to reach USD 128.33 billion by 2031 at 8.85% CAGR over 2026-2031. Tighter Prior Informed Consent (PIC) rules under the 2025 Basel Convention amendments, formal extended-producer-responsibility (EPR) mandates that set 70-80% recycling targets in the European Union (EU), India, and China, and more than USD 3 billion in U.S. federal grants for battery-recycling plants are together steering material flows away from informal yards toward licensed processors equipped with hydrometallurgical and pyrometallurgical lines. Formal recyclers are scaling robotics and debond-on-demand adhesives to lower disassembly costs, while hyperscale data-center refresh cycles are releasing high-grade printed-circuit boards rich in precious metals into Organization for Economic Cooperation and Development (OECD) markets. Strong commodity prices for copper, nickel, and lithium sustain urban-mining economics, and new provincial take-back rules in China, Canada, and Brazil are enlarging the legal collection pool, further supporting E-waste management market growth. Competitive rivalry is intensifying as metals refiners such as Umicore and Aurubis integrate upstream into collection and sorting in order to secure feedstock certainty.
Global E-waste Management Market Trends and Insights
Mandatory 70-80% EPR Recycling Targets & Real-time Certificate Trading in EU, India, China
The EU Waste Electrical and Electronic Equipment (WEEE) Directive, India's E-waste Management Rules 2022, and China's subsidy scheme now oblige producers to meet 70-80% collection ratios by weight. Real-time digital portals in Brussels, New Delhi, and Beijing let manufacturers buy electronic certificates from recyclers, converting compliance into a tradable asset and injecting liquidity into the E-waste management market. India's portal registered 1,200 Producer-Responsibility Organizations (PROs) by May 2024, trimming paperwork costs 20-30% and driving higher formal collections. China disbursed USD 390 million in 2025 to licensed dismantlers, raising throughput and depressing informal tonnage. The combined policies accelerate capital spending on automated plants and stimulate secondary-material supply chains.
Tightened 2025 Basel Convention E-waste Amendments Mandating Prior-Informed Consent Globally
The January 2025 Basel Convention revisions recategorize electronic scrap under hazardous (A1181) and non-hazardous (Y49) codes, forcing exporters to secure written clearance before shipment. Global transboundary flows fell 12% in the first half of 2025 versus 2024 as compliance paperwork extended transit by 4-8 weeks and raised freight bills 15-25%. Licensed processors in the EU and North America gained feedstock that previously leaked to informal hubs, lifting throughput rates and supporting the E-waste management market. Smaller brokers exited the trade due to the administrative load, prompting consolidation among large logistics providers. Over the medium term, the rule is expected to cement formal supply chains while shrinking the cost advantage of unregulated operators.
Entrenched Informal Dismantling Ecosystems in South & Southeast Asia Skewing Material Flows
Informal recyclers in India, Pakistan, Bangladesh, Vietnam, Indonesia, and the Philippines still treat 70-80% of discarded electronics in these countries, relying on open-burning and acid-leaching methods that expose laborers to toxic metals. Informal operators undercut licensed facilities by 20-30% because they skip environmental controls and taxes, diverting feedstock away from formal plants. Child involvement persists; the World Health Organization (WHO) estimates 18 million minors work in informal waste globally, many in e-waste. Enforcement of new EPR portals is uneven outside metro areas, allowing illegal yards to survive. Such leakage curbs collection for certified processors and drags on the E-waste management market revenue.
Other drivers and restraints analyzed in the detailed report include:
- U.S. IIJA & BIL Funding Waves Fueling USD 3 Billion Battery-Recycling Capacity Build-out
- Debond-On-Demand Adhesives & Modular Design Standards Slashing Disassembly Costs
- 2025 Basel PIC Rules Raising Logistics & Compliance Costs for Cross-border E-scrap Shipments
For complete list of drivers and restraints, kindly check the Table Of Contents.
Segment Analysis
Metals secured 56.96% of the E-waste management market share in 2025, reflecting their superior intrinsic value relative to plastics and glass. Copper yields from end-of-life electronics now meet 15% of refined demand, and gold and palladium extracted from printed-circuit boards command premium spot prices. Aurubis processed more than 1 million t of electronic scrap at its Lunen and Hamburg complexes in 2025, recovering copper, gold, and silver for semiconductor and wire clients. Rare-earth magnets recovered from hard-disk drives add neodymium and dysprosium to the supply pool as China narrows export quotas.
Urban-mining economics benefit from persistent high LME (London Metal Exchange) prices and declining average ore grades in primary mines, which shift capital toward recycling plants. Hydrometallurgical leaching lines at Umicore's Hoboken site uplift lithium-ion black-mass recovery rates to 95% for lithium, cobalt, and nickel. ISO 14001 and R2v3 certifications have become procurement prerequisites, funneling high-grade feedstock into certified smelters. As critical-material quotas under the EU Critical Raw Materials Act firm up, metal recovery is projected to expand at a 10.45% CAGR, further enlarging the E-waste management market size for metals.
The E-Waste Management Market Report is Segmented by Material (Metals, Plastics and More), by Source (IT & Telecommunication Equipment, Consumer Electronics, and More), by Service Type (Collection, Transportation & Sorting, Disposal/Treatment, and More), and by Geography (North America, South America, Europe, Middle East and Africa, and More). The Market Forecasts are Provided in Terms of Value (USD).
Geography Analysis
Asia-Pacific held 44.45% of the E-waste management market share in 2025 and is forecast to rise at a 9.5% CAGR through 2031. China awarded USD 390 million of 2025 dismantling subsidies that pushed informal operators toward licensing and doubled annual throughput in its top ten cities. India's live EPR-certificate portal lets producers trade obligations instantly, accelerating formal collections and imposing penalties on non-compliant brands. Japan's Home Appliance Recycling Act and South Korea's producer-take-back scheme both exceed 70% collection, creating a mature flow for high-value metals. Emerging ASEAN economies are drafting national frameworks but still struggle with enforcement; informal yards persist in rural belts.
Europe ranked second in 2025, buoyed by the WEEE Directive and the Basel PIC clampdown that keeps material inside the bloc. Yet only three member states met the 65% collection target in 2023, and the EU-wide average stood at 37.5%. Brussels now proposes tougher fines and CRM-recovery quotas that could lift regional hydrometallurgical capacity. Market leaders Veolia, ALBA, and Stena Metall are buying smaller firms to secure feedstock as exports narrow. Separate PV obligations under Directive 2024/884 will unlock new glass-to-glass lines, diversifying revenue streams.
North America is undergoing a capacity surge, anchored by USD 3 billion of IIJA and BIL grants. Redwood Materials, Ascend Elements, and American Battery Technology opened or expanded sites, and Li-Cycle secured Glencore offtake for its black mass. State EPR mandates in California, New York, and Washington plus Canada's provincial rules encourage large collectors such as ERI to standardize processes across borders. South America, the Middle East, and Africa remain nascent but Brazil and South Africa are drafting EPR bills that could seed future growth for the E-waste management market.
List of Companies Covered in this Report:
- Veolia Environnement SA
- TES - Sustainable IT Lifecycle Services
- Sims Lifecycle Services
- Umicore SA
- Electronic Recyclers International (ERI)
- Stena Metall AB
- ALBA Group
- Capital Environment Holdings Ltd.
- Enviro-Hub Holdings Ltd.
- Sembcorp Industries
- Waste Management Inc.
- Li-Cycle Holdings Corp.
- Aurubis AG
- Boliden AB
- Glencore Recycling
- MBA Polymers Inc.
- Desco Electronic Recyclers
- Enviroserve (Dubai)
- Retriev Technologies (Toxco)
- Tetronics International
Additional Benefits:
- The market estimate (ME) sheet in Excel format
- 3 months of analyst support
TABLE OF CONTENTS
1 Introduction
- 1.1 Study Assumptions & Market Definition
- 1.2 Scope of the Study
2 Research Methodology
3 Executive Summary
4 Market Insights and Dynamics
- 4.1 Market Overview
- 4.2 Market Drivers
- 4.2.1 Tightened 2025 Basel Convention E-Waste Amendments Mandating Prior-Informed Consent Globally
- 4.2.2 Mandatory 70-80 % EPR Recycling Targets & Real-time Certificate Trading in EU, India, China
- 4.2.3 U.S. IIJA & BIL Funding Waves Fueling $3 B+ Battery-Recycling Capacity Build-out
- 4.2.4 Data-Center Server Decommissioning for AI Workloads Releasing High-Grade e-Scrap in OECD
- 4.2.5 Debond-On-Demand Adhesives & Modular Design Standards Slashing Disassembly Costs
- 4.2.6 EU WEEE Directive Revision Drafts Introducing CRM-Focused Recovery Targets & Separate PV Stream
- 4.3 Market Restraints
- 4.3.1 Entrenched Informal Dismantling Ecosystems in South & Southeast Asia Skewing Material Flows
- 4.3.2 2025 Basel PIC Rules Raising Logistics & Compliance Costs for Cross-Border e-Scrap Shipments
- 4.3.3 Solid-State Battery Chemistries Lacking Industrial Recycling Routes & Safety Protocols
- 4.3.4 High-Adhesive, Miniaturized Consumer Devices Breaching New Contamination Thresholds for Plastics
- 4.4 Value / Supply-Chain Analysis
- 4.5 Regulatory Outlook
- 4.6 Technological Outlook
- 4.7 Insights on E-waste Production
- 4.8 Impact of Global Disruptions on the E-Waste Management Sector
- 4.9 Industry Attractiveness - Porter's Five Forces
- 4.9.1 Bargaining Power of Suppliers
- 4.9.2 Bargaining Power of Buyers
- 4.9.3 Threat of New Entrants
- 4.9.4 Threat of Substitutes
- 4.9.5 Intensity of Competitive Rivalry
5 Market Size & Growth Forecasts (Value, In USD Billion)
- 5.1 By Material
- 5.1.1 Metals
- 5.1.2 Plastics
- 5.1.3 Glass
- 5.1.4 Others
- 5.2 By Source
- 5.2.1 IT & Telecommunication Equipment
- 5.2.2 Consumer Electronics
- 5.2.3 Household Appliances
- 5.2.4 Medical Equipment
- 5.2.5 Industrial Equipment
- 5.2.6 EV Batteries
- 5.2.7 Solar PV Panels
- 5.2.8 Others (Agricultural Equipment, Curb-side waste, construction, etc.)
- 5.3 By Service Type
- 5.3.1 Collection, Trasportation & Sorting
- 5.3.2 Disposal/ Treatment
- 5.3.2.1 Refurbishment & Reuse
- 5.3.2.2 Landfill/ Incineration
- 5.3.3 Recycling & Recovery
- 5.3.3.1 Mechanical Separation
- 5.3.3.2 Hydrometallurgical Process
- 5.3.3.3 Pyrometallurgical Process
- 5.3.3.4 Biometallurgical Process
- 5.4 By Geography
- 5.4.1 North America
- 5.4.1.1 United States
- 5.4.1.2 Canada
- 5.4.1.3 Mexico
- 5.4.2 South America
- 5.4.2.1 Brazil
- 5.4.2.2 Argentina
- 5.4.2.3 Chile
- 5.4.2.4 Rest of South America
- 5.4.3 Europe
- 5.4.3.1 United Kingdom
- 5.4.3.2 Germany
- 5.4.3.3 France
- 5.4.3.4 Italy
- 5.4.3.5 Spain
- 5.4.3.6 BENELUX (Belgium, Netherlands, and Luxembourg)
- 5.4.3.7 NORDICS (Denmark, Finland, Iceland, Norway, and Sweden)
- 5.4.3.8 Rest of Europe
- 5.4.4 Middle East and Africa
- 5.4.4.1 Saudi Arabia
- 5.4.4.2 United Arab Emirates
- 5.4.4.3 Qatar
- 5.4.4.4 Kuwait
- 5.4.4.5 Turkey
- 5.4.4.6 Egypt
- 5.4.4.7 South Africa
- 5.4.4.8 Nigeria
- 5.4.4.9 Rest of Middle East and Africa
- 5.4.5 Asia-Pacific
- 5.4.5.1 China
- 5.4.5.2 India
- 5.4.5.3 Japan
- 5.4.5.4 South Korea
- 5.4.5.5 Australia
- 5.4.5.6 ASEAN (Indonesia, Thailand, Philippines, Malaysia, Vietnam)
- 5.4.5.7 Rest of Asia-Pacific
- 5.4.1 North America
6 Competitive Landscape
- 6.1 Market Concentration
- 6.2 Strategic Moves
- 6.3 Market Share Analysis
- 6.4 Company Profiles (includes Global-level Overview, Market-level Overview, Core Segments, Financials, Strategic Information, Products & Services, Recent Developments)
- 6.4.1 Veolia Environnement SA
- 6.4.2 TES - Sustainable IT Lifecycle Services
- 6.4.3 Sims Lifecycle Services
- 6.4.4 Umicore SA
- 6.4.5 Electronic Recyclers International (ERI)
- 6.4.6 Stena Metall AB
- 6.4.7 ALBA Group
- 6.4.8 Capital Environment Holdings Ltd.
- 6.4.9 Enviro-Hub Holdings Ltd.
- 6.4.10 Sembcorp Industries
- 6.4.11 Waste Management Inc.
- 6.4.12 Li-Cycle Holdings Corp.
- 6.4.13 Aurubis AG
- 6.4.14 Boliden AB
- 6.4.15 Glencore Recycling
- 6.4.16 MBA Polymers Inc.
- 6.4.17 Desco Electronic Recyclers
- 6.4.18 Enviroserve (Dubai)
- 6.4.19 Retriev Technologies (Toxco)
- 6.4.20 Tetronics International
7 Market Opportunities & Future Outlook
- 7.1 White-space & Unmet-Need Assessment

