PUBLISHER: Mordor Intelligence | PRODUCT CODE: 2044082

PUBLISHER: Mordor Intelligence | PRODUCT CODE: 2044082
Trading Card Game - Market Share Analysis, Industry Trends & Statistics, Growth Forecasts (2026 - 2031)
The Trading Card Game Market size is expected to increase from USD 13.28 billion in 2025 to USD 15.11 billion in 2026 and reach USD 24.36 billion by 2031, growing at a CAGR of 10.03% over 2026-2031.
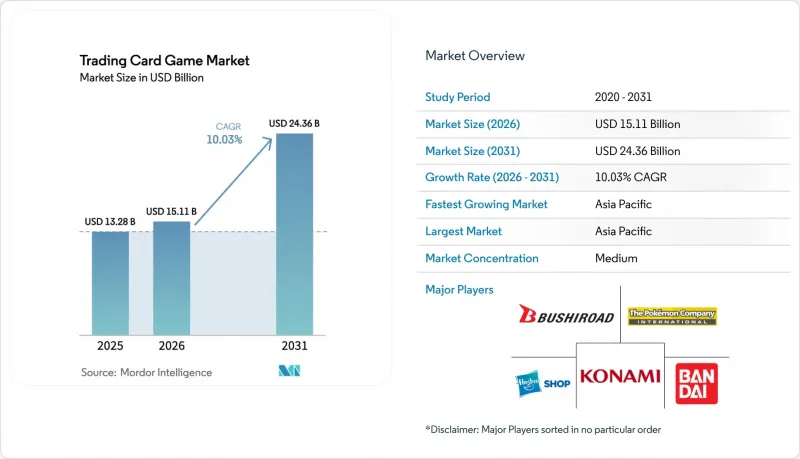
Growth is fueled by digital distribution, rising adult investment demand, and expanding anime and sports licensing partnerships. Character cards secure enduring relevance through cross-media story lines, while sports-themed sets translate live-event excitement into card demand. Mobile-first platforms unlock high average revenue per user and broaden geographic reach, especially across Asia-Pacific. In North America, organized esports circuits and professional grading services deepen secondary-market liquidity and keep the trading card game market resilient despite raw-material cost pressure.
Global Trading Card Game Market Trends and Insights
Esports integration driving organized play and media-rights monetization
Professional circuits now award sizable cash purses, while university leagues create talent pipelines. In the United States, streaming platforms such as Twitch attracted 127,500 average concurrent viewers for digital TCG broadcasts in 2024, up 32% year on year . Rights deals raise visibility, draw sponsors, and incentivize publishers to standardize rule sets, adding predictable seasonal content that sustains engagement. Retailers benefit from demand for tournament-legal reprints, and grading firms record higher submission volumes for prize cards sought by investors.
Post-pandemic resurgence of hobby stores boosting booster-pack sales
Specialty outlets have evolved into experiential hubs, offering demo stations, in-store tournaments, and trade nights. TCGplayer's 2024 hobby shop awards highlighted retailers such as Aegis Games and BAM Goleta for converting casual visitors into repeat buyers through community programs . Foot traffic translates into sales of accessories, graded-card sleeves, and limited-edition sets that are rarely discounted online. These stores also host pre-release events that create localized hype and early secondary-market liquidity.
Counterfeit-card proliferation undermining trust
Advanced forgeries now replicate holographic foils and micro-text, eroding buyer confidence, particularly in Southeast Asia, where authentication services remain scarce. Guides on identifying fake Pokemon cards receive sustained traffic. Blockchain provenance tags and embedded NFC chips offer technical countermeasures, yet add cost that can limit mass-market deployment. Lower transaction volumes and wider bid-ask spreads persist in marketplaces reporting repeated fraud incidents.
Other drivers and restraints analyzed in the detailed report include:
- Rising adult collectors treating sports cards as alternative investments
- Mobile-based digital TCGs delivering micro-transaction uplift
- Supply-chain paper shortages raising production costs
For complete list of drivers and restraints, kindly check the Table Of Contents.
Segment Analysis
Character cards held a 60.78% trading card game market share in 2025, equivalent to roughly USD 3.35 billion in trading card game market size. Their appeal rests on cross-media storytelling that encourages collectors to chase complete narrative arcs, aligning with anime release calendars. Bandai Namco shipped 13.1 billion units cumulatively since 1988 and recorded an 18.1% year-on-year rise in card revenues to JPY 286.3 billion (USD 1.99 billion) in FY-2024. Advances in print technology introduce layered foils and security threads, lifting average selling prices and differentiating authentic products from counterfeits. Autograph cards, supported by athlete sign-and-send events, post a forecast 11.65% CAGR, while image cards retain niche relevance through limited promotional drops that foster completionist behavior.
Parallel rarity tiers create a laddered product hierarchy. Ultra-premium formats with serialized numbering and textured foils command immediate aftermarket demand and push the trading card game market toward luxury positioning. Publishers use scarcity structures to stagger launches, smoothing revenue between main set releases. Graders adjust authentication protocols to accommodate new materials, ensuring liquidity for high-end variants.
The Trading Card Game Market is Segmented by Card Type (Character Card, Autograph Card, Image Card), Application (Sports Game, Non-Sports Game), and Geography (North America, South America, Europe, Asia-Pacific, Middle East, and Africa). The Market Forecasts are Provided in Terms of Value (USD).
Geography Analysis
Asia-Pacific delivers the swiftest expansion at a 11.04% CAGR. Japan's card segment alone reached JPY 286.3 billion (USD 1.99 billion) in FY-2024, underlining robust domestic fandom. Web3 mobile titles produced the highest per-user returns globally, validating the micro-transaction model. Anime exports accelerate demand in Southeast Asia and South America, where localized dubbing broadens reach. Regional publishers capitalize on smartphone penetration to bypass physical distribution challenges and test dynamic pricing events.
North America has captured 26.94% of the trading card game market share in 2025. High penetration of grading services, evidenced by PSA's 15.34 million submissions in 2024, bolsters confidence in secondary trading. Supply-chain headwinds, notably elevated pulp prices, squeeze publisher margins, while exclusive sports licensing heightens antitrust scrutiny. Retail ecosystems still enjoy dense networks of hobby shops that anchor community tournaments and in-person buying.
Western Europe records mature but steady momentum, supported by a revitalized brick-and-mortar channel. Hobby shops invest in league nights that boost booster-pack velocity. Demographic drag from low birth rates necessitates marketing toward older cohorts possessing higher disposable income. Regulatory debate on loot-box mechanics pressures digital monetization strategies, prompting transparency mandates on pack odds .
South America rises as an adjacent opportunity, strengthened by anime licensing growth. Toei Animation logged record FY-2025 sales on the back of Dragon Ball and One Piece merchandise. Currency volatility and import fees present pricing challenges, but digital storefronts and region-specific promos soften barriers. Collectors gravitate to lower-cost starter sets before upgrading to graded imports, broadening market funnel depth.
- Hasbro Inc.
- The Pokemon Company International
- Konami Holdings Corporation
- Bandai Co. Ltd.
- Bushiroad Inc.
- Panini Group
- Topps Company (Fanatics)
- Upper Deck Company
- Asmodee Group
- Ravensburger AG
- Mattel
- Cygames Inc.
- Riot Games, Inc.
- Square Enix Co. Ltd.
- Cryptozoic Entertainment
- Steve Jackson Games
- Alderac Entertainment Group
- Legend Story Studios Limited
Additional Benefits:
- The market estimate (ME) sheet in Excel format
- 3 months of analyst support
TABLE OF CONTENTS
1 INTRODUCTION
- 1.1 Study Assumptions and Market Definition
- 1.2 Scope of the Study
2 RESEARCH METHODOLOGY
3 EXECUTIVE SUMMARY
4 MARKET LANDSCAPE
- 4.1 Market Overview
- 4.2 Market Drivers
- 4.2.1 Esports Integration Driving Organized Play and Media Rights Monetization in North America
- 4.2.2 Post-Pandemic Resurgence of Hobby Stores Boosting Booster-Pack Sales in Europe
- 4.2.3 Rising Adult Collectors Treating Sports Cards as Alternative Investments in US and Asia
- 4.2.4 Mobile-Based Digital TCGs Delivering Micro-Transaction Uplift in Asia-Pacific
- 4.3 Market Restraints
- 4.3.1 Counterfeit-Card Proliferation Undermining Trust in Emerging Asian Markets
- 4.3.2 Supply-Chain Paper Shortages Raising Production Costs for North-American Printers
- 4.4 Regulatory Outlook
- 4.5 Assessment of Impact of Macroeconomic Trends
- 4.6 Investment Landscape and Funding Trends
- 4.7 Porter's Five Forces Analysis
- 4.7.1 Bargaining Power of Suppliers
- 4.7.2 Bargaining Power of Consumers
- 4.7.3 Threat of New Entrants
- 4.7.4 Threat of Substitute Products
- 4.7.5 Intensity of Competitive Rivalry
5 MARKET SIZE AND GROWTH FORECASTS (VALUE)
- 5.1 By Card Type
- 5.1.1 Character Card
- 5.1.2 Autograph Card
- 5.1.3 Image Card
- 5.2 By Application
- 5.2.1 Sports Game
- 5.2.2 Non-Sports Game
- 5.3 By Geography
- 5.3.1 North America
- 5.3.1.1 United States
- 5.3.1.2 Canada
- 5.3.1.3 Mexico
- 5.3.2 South America
- 5.3.2.1 Brazil
- 5.3.2.2 Argentina
- 5.3.2.3 Rest of South America
- 5.3.3 Europe
- 5.3.3.1 Germany
- 5.3.3.2 United Kingdom
- 5.3.3.3 France
- 5.3.3.4 Italy
- 5.3.3.5 Spain
- 5.3.3.6 Rest of Europe
- 5.3.4 Asia-Pacific
- 5.3.4.1 China
- 5.3.4.2 Japan
- 5.3.4.3 South Korea
- 5.3.4.4 India
- 5.3.4.5 Rest of Asia-Pacific
- 5.3.5 Middle East and Africa
- 5.3.5.1 United Arab Emirates
- 5.3.5.2 Saudi Arabia
- 5.3.5.3 South Africa
- 5.3.5.4 Rest of Middle East and Africa
- 5.3.1 North America
6 COMPETITIVE LANDSCAPE
- 6.1 Strategic Developments
- 6.2 Vendor Positioning Analysis
- 6.3 Company Profiles (includes Global level Overview, Market level overview, Core Segments, Financials as available, Strategic Information, Products and Services, and Recent Developments)
- 6.3.1 Hasbro Inc.
- 6.3.2 The Pokemon Company International
- 6.3.3 Konami Holdings Corporation
- 6.3.4 Bandai Co. Ltd.
- 6.3.5 Bushiroad Inc.
- 6.3.6 Panini Group
- 6.3.7 Topps Company (Fanatics)
- 6.3.8 Upper Deck Company
- 6.3.9 Asmodee Group
- 6.3.10 Ravensburger AG
- 6.3.11 Mattel
- 6.3.12 Cygames Inc.
- 6.3.13 Riot Games, Inc.
- 6.3.14 Square Enix Co. Ltd.
- 6.3.15 Cryptozoic Entertainment
- 6.3.16 Steve Jackson Games
- 6.3.17 Alderac Entertainment Group
- 6.3.18 Legend Story Studios Limited
7 MARKET OPPORTUNITIES AND FUTURE OUTLOOK
- 7.1 White-Space and Unmet-Need Assessment

