
PUBLISHER: Mordor Intelligence | PRODUCT CODE: 2044104

PUBLISHER: Mordor Intelligence | PRODUCT CODE: 2044104
Asia-Pacific Data Center Cooling - Market Share Analysis, Industry Trends & Statistics, Growth Forecasts (2026 - 2031)
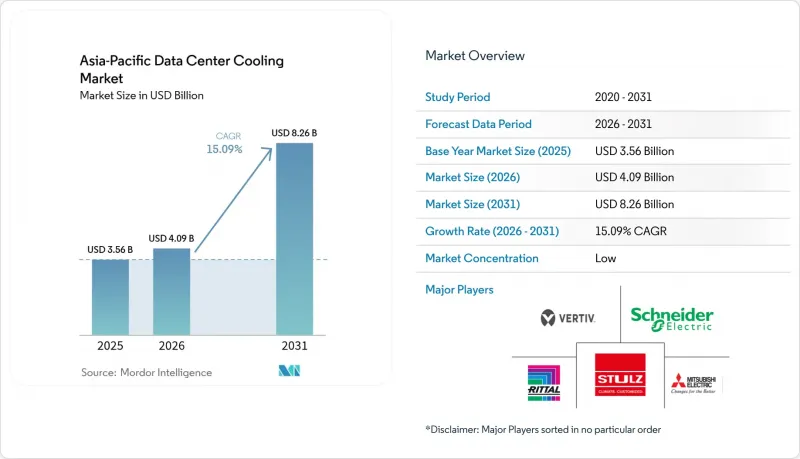
The Asia-Pacific data center cooling market size is expected to increase from USD 3.56 billion in 2025 to USD 4.09 billion in 2026 and reach USD 8.26 billion by 2031, growing at a CAGR of 15.09% over 2026-2031.
Accelerating adoption of generative-AI servers, mandatory efficiency codes such as China's PUE <= 1.3 rule and Singapore's SS 715:2025 standard, and hyperscale build-outs by Microsoft, Google, Alibaba, and Tencent are expanding demand for high-performance thermal systems. Liquid architectures are gaining traction because air-based cooling reaches economic and technical limits above 30 kW per rack, yet air solutions still dominate legacy estates and sub-30 kW deployments. Vendors that combine hardware, software, and rapid prefabrication are winning contracts as operators compress build schedules from 18 months to six. Supply-chain risk is easing after 2024 steel and semiconductor shortages, but HVAC-skilled labor gaps in Southeast Asia remain a near-term bottleneck.
Asia-Pacific Data Center Cooling Market Trends and Insights
AI/Gen-AI Rack Power Densification Drives Liquid Pivot
Generative-AI clusters are lifting rack densities from 8-12 kW toward 40-60 kW, where air systems lose both cost and thermal headroom. Lenovo's Neptune direct-to-chip platform installed at NTT's Tokyo campus in 2025 saved 40% energy while supporting 50 kW racks, and China's 2024 code now obliges liquid cooling above 8 kW per cabinet. Singapore's updated SS 715 demands PUE < 1.2 for high-density halls.At densities beyond 30 kW, immersion designs eliminate chillers and cut total cost of ownership by up to 30%, although uptake is moderated by OEM warranty terms and a shortage of technicians versed in dielectric-fluid safety. The Asia-Pacific data center cooling market is therefore shifting capital toward pumps, plates, and heat-exchanger modules that underpin liquid loops.
Hyperscale Build-Outs by Cloud Majors Anchor Demand
Microsoft's USD 17.5 billion India program and Google's USD 15 billion Andhra Pradesh campus each require 200-300 MW of IT load, absorbing 15-20% of regional chiller output through 2027. Oracle's multi-country region specified six-month delivery of modular mechanical blocks, accelerating orders for Vertiv and Schneider Electric. Chinese giants Alibaba and Tencent added 180 MW in 2025, drawn by land subsidies in Guangdong and Jiangsu that are conditional on 50% renewable sourcing. The hyperscale wave bifurcates the vendor field, rewarding suppliers with liquid IP and balance-sheet strength capable of vendor financing.
Rising Electricity and Land Costs Compress Margins
Singapore's tariff climbed to SGD 0.35/kWh in 2025 (USD 0.26/kWh) and the city's land scarcity allocates only 300 MW of extra IT load through 2030, inflating plots above SGD 1,000 ft2 (USD 695 ft2). Tokyo inner districts exceed USD 15,000 m2, triggering capacity shifts to Osaka despite latency penalties. Similar pressures in Sydney and Hong Kong redirect builds toward outer suburbs or Guangdong, but grid and fiber gaps undermine quick scaling. Because air cooling can represent 40% of a facility's power bill versus 15% for liquid, cost inflation is nudging incumbents to retrofit direct-to-chip loops even on brownfield assets.
Other drivers and restraints analyzed in the detailed report include:
- Edge Data Centers at 5G Micro-Regions Need Compact Cooling
- Corporate Net-Zero and RE100 Pledges Elevate Efficiency
- Water-Use Restrictions Squeeze Evaporative Architectures
For complete list of drivers and restraints, kindly check the Table Of Contents.
Segment Analysis
Air-based systems delivered 59.96% revenue in 2025, supported by entrenched operational know-how and a vast installed base. Yet the Asia-Pacific data center cooling market size for liquid architectures is forecast to expand at a 16.13% CAGR as generative-AI racks exceed 40 kW, a density where rear-door exchangers and immersion tanks outrun fan-driven CRAC units. Immersion deployments at Keppel Data Centres achieved PUE 1.03 and removed chillers entirely, proving a 25% capex and 40% opex cut over air baselines. Direct-to-chip loops from CoolIT allowed 50 kW retrofits in Japanese and Australian halls, adding seven years to asset life.
Despite liquid's momentum, air cooling preserves tactical advantages below 30 kW, in climates with extended free-cooling windows, and in markets short on dielectric-fluid skills such as Indonesia and Vietnam. Daikin's magnetic-bearing chillers reached 0.45 kW per ton in Tokyo, sustaining air's relevance where water limits prohibit towers. The Asia-Pacific data center cooling market continues to reward hybrid estates that blend fan coils for low-density rows with pumped liquid loops for AI zones, easing migration paths for cautious operators.
Computer-room air handlers maintained 41.55% share in 2025, but demand is tilting toward pumps, valves, and plate heat exchangers that orchestrate liquid loops. Grundfos and Xylem introduced variable-speed pumps tailored to 35-60 °C water, securing Microsoft and Google contracts in India. Alfa Laval's Compabloc plates hit 95% heat-transfer efficiency inside immersion shells, driving multi-megawatt orders from Singapore and Tokyo.
Chillers bifurcate between high-efficiency magnetic-bearing units for air halls and compact skid exchangers for liquid districts. Monitoring software now grows fastest at roughly 17% CAGR, with Schneider Electric EcoStruxure IT and Vertiv Trellis trimming energy 10-15% via machine-learning set-point control. As liquid penetration deepens, the Asia-Pacific data center cooling market will progressively prize precision flow hardware over bulk air movers.
The Asia Pacific Data Center Cooling Market Report is Segmented by Cooling Technology (Air-Based, and Liquid-Based), Cooling Component (CRAH/CRAC, Chillers and Heat Exchangers, Cooling Towers and Dry Coolers, and More), Tier Type (Tier 1 and 2, and Tier 4), Data Center Size (Small, Medium, Large, and Hyperscale), Data Center Type (Colocation, and More), and Country. The Market Forecasts are Provided in Terms of Value (USD).
List of Companies Covered in this Report:
- Vertiv Group Corp.
- Schneider Electric SE
- STULZ GmbH
- Huawei Digital Power Technologies Co., Ltd.
- Johnson Controls International plc
- Rittal GmbH & Co. KG
- Daikin Applied (Daikin Industries, Ltd.)
- Fujitsu General Limited
- Mitsubishi Electric Corporation
- Hitachi Cooling and Heating (Johnson Controls-Hitachi Air Conditioning)
- Baltimore Aircoil Company
- Nortek Air Solutions LLC
- Delta Electronics, Inc.
- Grundfos Holding A/S
- CoolIT Systems, Inc.
- Submer Technologies, S.L.
- Iceotope Technologies Ltd.
- Alfa Laval AB
- Trane Technologies plc
- NTT Facilities, Inc.
- Xylem Inc.
- Refrion S.r.l.
- Green Revolution Cooling, Inc.
- Munters AB
Additional Benefits:
- The market estimate (ME) sheet in Excel format
- 3 months of analyst support
TABLE OF CONTENTS
1 INTRODUCTION
- 1.1 Study Assumptions and Market Definition
- 1.2 Scope of the Study
2 RESEARCH METHODOLOGY
3 EXECUTIVE SUMMARY
4 MARKET LANDSCAPE
- 4.1 Market Overview
- 4.2 Market Drivers
- 4.2.1 AI/Gen-AI Rack Power Densification
- 4.2.2 Hyperscale Build-Outs by US and Chinese Cloud Majors
- 4.2.3 Edge Data Centers at 5G Micro-Regions
- 4.2.4 Corporate Net-Zero and RE100 Pledges
- 4.2.5 Modular Prefabricated Cooling Blocks
- 4.2.6 District-Cooling Integration Pilots (Singapore-Style)
- 4.3 Market Restraints
- 4.3.1 Rising Electricity and Land Costs in Tier-1 APAC Cities
- 4.3.2 Scarcity of HVAC-Certified Labor in Emerging Southeast Asia
- 4.3.3 Water-Use Restrictions in Drought-Prone India and Australia
- 4.3.4 Lengthy Environmental Permitting and Community Pushback
- 4.4 Industry Supply-Chain Analysis
- 4.5 Regulatory Landscape
- 4.6 Impact of Macroeconomic Factors on the Market
- 4.7 Porter's Five Forces Analysis
- 4.7.1 Threat of New Entrants
- 4.7.2 Bargaining Power of Buyers
- 4.7.3 Bargaining Power of Suppliers
- 4.7.4 Threat of Substitute Products
- 4.7.5 Intensity of Competitive Rivalry
5 ANALYSIS OF THE CURRENT DATA CENTER FOOTPRINT IN ASIA-PACIFIC
- 5.1 Analysis of IT Load Capacity (MW) and Area footprint (Sq. Ft.) of Data Centers (for the Period of 2019-2031)
- 5.2 Analysis of Major Data Center Hotspots in Asia-Pacific
- 5.3 Analysis of Major Upcoming Hyperscale Facilities in Asia-Pacific
6 MARKET SIZE AND GROWTH FORECASTS (VALUE)
- 6.1 By Cooling Technology
- 6.1.1 Air-Based Cooling
- 6.1.1.1 CRAH
- 6.1.1.2 Chiller and Economizer
- 6.1.1.3 Cooling Tower (Direct, Indirect, Two-Stage)
- 6.1.1.4 Others
- 6.1.2 Liquid-Based Cooling
- 6.1.2.1 Immersion Cooling
- 6.1.2.2 Direct-to-Chip Cooling
- 6.1.2.3 Rear-Door Heat Exchanger
- 6.1.1 Air-Based Cooling
- 6.2 By Cooling Component
- 6.2.1 Computer-Room Air Handlers (CRAH/CRAC)
- 6.2.2 Chillers and Heat-Exchanger Units
- 6.2.3 Cooling Towers and Dry Coolers
- 6.2.4 Pumps and Valves
- 6.2.5 Control and Monitoring Software
- 6.3 By Tier Type
- 6.3.1 Tier 1 and 2
- 6.3.2 Tier 3
- 6.3.3 Tier 4
- 6.4 By Data Center Size
- 6.4.1 Small Data Center
- 6.4.2 Medium Data Center
- 6.4.3 Large Data Center
- 6.4.4 Hyperscale Data Center
- 6.5 By Data Center Type
- 6.5.1 Colocation Data Center
- 6.5.2 Hyperscalers Data Center/CSPs
- 6.5.3 Enterprise and Edge Data Center
- 6.6 By Country
- 6.6.1 China
- 6.6.2 Japan
- 6.6.3 India
- 6.6.4 South-Korea
- 6.6.5 Australia and New Zealand
- 6.6.6 Rest of Asia-Pacific
7 COMPETITIVE LANDSCAPE
- 7.1 Market Share Analysis
- 7.2 Company Profiles (Includes Global Level Overview, Market Level Overview, Core Segments, Financials as Available, Strategic Information, Market Rank/Share, Products and Services, and Recent Developments)
- 7.2.1 Vertiv Group Corp.
- 7.2.2 Schneider Electric SE
- 7.2.3 STULZ GmbH
- 7.2.4 Huawei Digital Power Technologies Co., Ltd.
- 7.2.5 Johnson Controls International plc
- 7.2.6 Rittal GmbH & Co. KG
- 7.2.7 Daikin Applied (Daikin Industries, Ltd.)
- 7.2.8 Fujitsu General Limited
- 7.2.9 Mitsubishi Electric Corporation
- 7.2.10 Hitachi Cooling and Heating (Johnson Controls-Hitachi Air Conditioning)
- 7.2.11 Baltimore Aircoil Company
- 7.2.12 Nortek Air Solutions LLC
- 7.2.13 Delta Electronics, Inc.
- 7.2.14 Grundfos Holding A/S
- 7.2.15 CoolIT Systems, Inc.
- 7.2.16 Submer Technologies, S.L.
- 7.2.17 Iceotope Technologies Ltd.
- 7.2.18 Alfa Laval AB
- 7.2.19 Trane Technologies plc
- 7.2.20 NTT Facilities, Inc.
- 7.2.21 Xylem Inc.
- 7.2.22 Refrion S.r.l.
- 7.2.23 Green Revolution Cooling, Inc.
- 7.2.24 Munters AB
8 MARKET OPPORTUNITIES AND FUTURE OUTLOOK
- 8.1 White-Space and Unmet-Need Assessment

