
PUBLISHER: Mordor Intelligence | PRODUCT CODE: 2044105

PUBLISHER: Mordor Intelligence | PRODUCT CODE: 2044105
North America Data Center Cooling - Market Share Analysis, Industry Trends & Statistics, Growth Forecasts (2026 - 2031)
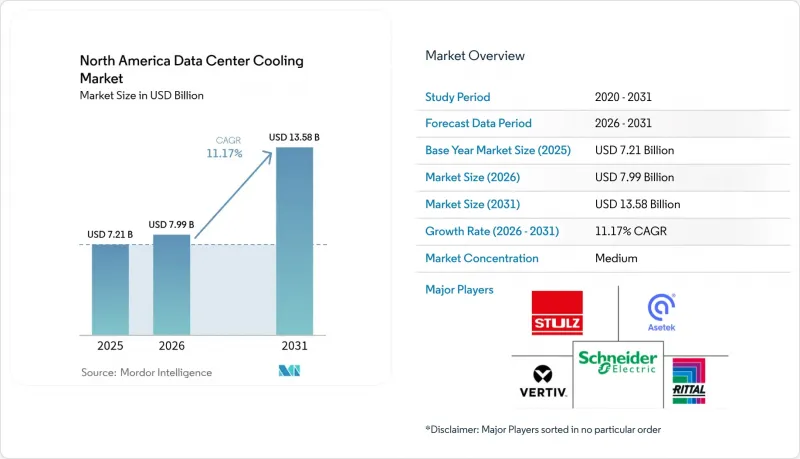
The North America data center cooling market size is projected to be USD 7.21 billion in 2025, USD 7.99 billion in 2026, and reach USD 13.58 billion by 2031, growing at a CAGR of 11.17% from 2026 to 2031.
Rising rack densities above 40 kilowatts are pressuring operators to swap legacy air systems for liquid architectures that draw heat directly from processors, a shift reinforced by federal mandates that link lease renewals to power-usage-effectiveness benchmarks. Inflation Reduction Act tax credits covering up to 30% of eligible equipment costs accelerate the retirement of high-GWP chillers, while state water-use caps in desert markets push demand for closed-loop dry coolers. Competitive intensity remains elevated as HVAC majors retrofit chiller portfolios and liquid-cooling specialists secure design wins by guaranteeing sub-25 °C chip temperatures. Developers are also navigating power-grid constraints in Northern Virginia and drought-related insurance surcharges that influence site selection and total cost of ownership.
North America Data Center Cooling Market Trends and Insights
Stringent PUE Targets Under U.S. Executive Order on Federal Sustainability
Federal agencies must now prove PUE ratios below 1.4 for new builds and below 1.5 for existing sites by fiscal 2027, effectively disqualifying legacy raised-floor designs that rely on perimeter air handlers. Updated leasing rules require landlords to share sub-metered cooling energy data, giving tenants the right to terminate contracts if efficiency covenants are missed. Contractors are pivoting to modular chiller plants with variable-speed compressors that trim PUE by up to 0.20 points. Defense workloads that once favored air-gapped security are adopting rear-door heat exchangers to cut the load seen by central plants. Commercial tenants are mirroring federal expectations, forcing multi-tenant providers to guarantee similar efficiency thresholds.
Escalating Rack Densities in Hyperscale Facilities
Training clusters for frontier AI models routinely exceed 40 kW per rack, with some GPU configurations nearing 80 kW as high-bandwidth memory and multi-die packages condense heat output. Air systems struggle to keep inlet temperatures under 27 °C at these loads without energy-intensive fan over-provisioning. Hyperscalers are moving to direct-to-chip cold plates that intercept 70%-90% of processor heat before it enters room air, easing demand on air handlers. This density also reshapes site selection, pushing operators toward regions with affordable electricity and climates that permit more free-cooling hours. Legacy air infrastructure is being repurposed for lower-density storage rows, maximizing sunk investments while liquid systems protect the compute core.
Power-Grid Constraints Delaying New Builds in Northern Virginia
Dominion Energy's transmission queue listed more than 7 GW of interconnection requests in January 2026, with average waits of 36 months for projects needing new substations. Underinvestment in 500 kV lines and local opposition to new corridors stall capacity expansions and force developers to explore backup generation or relocate to Ohio and North Carolina. Interim solutions such as hydrogen fuel cells add significant capital expense and trigger additional air-permit reviews. Some operators downsize footprints to fit within existing feeder headroom, fragmenting once-megasite-oriented investment plans. The congestion risk also elevates financing costs, as lenders price delays into required returns.
Other drivers and restraints analyzed in the detailed report include:
- Growing Adoption of Liquid Cooling for AI and ML Workloads
- Inflation Reduction Act Tax Credits for Low-GWP Chillers
- Volatility in Refrigerant Prices Amid HFC Phase-Down
For complete list of drivers and restraints, kindly check the Table Of Contents.
Segment Analysis
Liquid-based approaches will grow at a 12.54% CAGR through 2031, far ahead of air methods that still dominated with 59.64% share in 2025. The North America data center cooling market size for liquid solutions is expanding as hyperscalers retrofit compute rows that now host GPUs drawing 40-80 kW per rack. Immersion baths in edge nodes solve space and acoustic limits, while direct-to-chip plates dominate large training clusters. Rear-door heat exchangers act as a bridge, extending the life of air-cooled halls and reducing capex burdens. HVAC vendors disclose multi-hundred-percent order growth for liquid skids, signaling a secular pivot rather than a niche experiment. Regulatory pushes for low-GWP refrigerants further encourage operators to bypass chillers altogether, relying on warm-water loops that reject heat through dry coolers.
The hybridization trend means both technologies will coexist. Operators segment halls by workload, dedicating liquid zones to AI while leaving storage and network gear on air cooling. This flexible approach protects prior investments and allows gradual skill-set development among facilities staff. Suppliers now bundle control software that orchestrates both regimes, shifting workloads to racks with the most favorable thermal headroom. As liquid penetration rises, aftermarket demand emerges for sensors, fittings, and quick-disconnect couplings, opening ancillary revenue pools. The North America data center cooling market continues to witness pilots that evaluate two-phase refrigerant loops, though commercial readiness may postdate the current forecast period.
Computer room air handlers held 40.72% share in 2025, reflecting the historical base of raised-floor halls across the region. Yet pumps and valves are projected to rise at a 12.66% CAGR, mirroring the liquid-technology surge. Modern loops require precision flow control; even slight imbalances can spike chip temperatures and throttle performance. Manufacturers respond with variable-speed pumps featuring embedded flow sensors and smart valves that auto-balance circuits in real time. Chillers remain the single largest line-item in capital projects, but their role shifts toward modularity, arriving on site in 500 kW blocks that match staged IT deployments.
Control software differentiates offerings as AI-driven platforms learn load patterns and pre-cool loops before inference bursts. Operators integrate these systems with workload schedulers so compute and cooling act as a unified efficiency engine. Hybrid dry-coolers cut water draw by 60-70%, aiding compliance in jurisdictions with withdrawal caps. Upstream component vendors enjoy pull-through sales as hyperscalers lock in multi-year contracts to guarantee supply continuity. The North America data center cooling market share for traditional air components will erode, but retrofit demand ensures an extended tail for replacement filters, belts, and economizer kits.
The North America Data Center Cooling Market Report is Segmented by Cooling Technology (Air-Based, and Liquid-Based), Cooling Component (CRAH/CRAC, Chillers and Heat Exchangers, Cooling Towers and Dry Coolers, and More), Tier Type (Tier 1 and 2, and Tier 4), Data Center Size (Small, Medium, Large, and Hyperscale), Data Center Type (Colocation, and More), and Country. The Market Forecasts are Provided in Terms of Value (USD).
List of Companies Covered in this Report:
- Vertiv Group Corp.
- Stulz GmbH
- Schneider Electric SE
- Rittal GmbH and Co. KG
- Asetek A/S
- Alfa Laval AB
- Iceotope Technologies Ltd.
- Green Revolution Cooling Inc.
- Chilldyne Inc.
- Airedale International Air-Conditioning Ltd.
- Nortek Air Solutions LLC
- Mitsubishi Electric Corporation
- Johnson Controls International plc
- Munters Group AB
- Delta Electronics Inc.
- Hewlett Packard Enterprise Company
- IBM Corporation
- Cisco Systems Inc.
- LiquidStack Inc.
- Submer Technologies, S.L.
- CoolIT Systems Inc.
- Trane Technologies plc
- Super Micro Computer Inc.
Additional Benefits:
- The market estimate (ME) sheet in Excel format
- 3 months of analyst support
TABLE OF CONTENTS
1 INTRODUCTION
- 1.1 Study Assumptions and Market Definition
- 1.2 Scope of the Study
2 RESEARCH METHODOLOGY
3 EXECUTIVE SUMMARY
4 MARKET LANDSCAPE
- 4.1 Market Overview
- 4.2 Market Drivers
- 4.2.1 Stringent PUE Targets Under U.S. Executive Order on Federal Sustainability
- 4.2.2 Escalating Rack Densities in Hyperscale Facilities
- 4.2.3 Growing Adoption of Liquid Cooling for AI/ML Workloads
- 4.2.4 Heat-To-District Energy Purchase Agreements in Canadian Provinces
- 4.2.5 Inflation Reduction Act Tax Credits for Low-GWP Refrigerant Chillers
- 4.2.6 State-Level Water Withdrawal Caps Accelerating Closed-Loop Retrofits
- 4.3 Market Restraints
- 4.3.1 Volatility in Refrigerant Prices Amid HFC Phase-Down
- 4.3.2 Power-Grid Constraints Delaying New Builds in Northern Virginia
- 4.3.3 Limited Skills for Immersion-Cooling Maintenance
- 4.3.4 Insurance-Premium Surcharges for Water-Based Systems in Drought Zones
- 4.4 Industry Supply-Chain Analysis
- 4.5 Regulatory Landscape
- 4.6 Impact of Macroeconomic Factors on the Market
- 4.7 Porter's Five Forces Analysis
- 4.7.1 Threat of New Entrants
- 4.7.2 Bargaining Power of Buyers
- 4.7.3 Bargaining Power of Suppliers
- 4.7.4 Threat of Substitute Products
- 4.7.5 Intensity of Competitive Rivalry
5 ANALYSIS OF THE CURRENT DATA CENTER FOOTPRINT IN NORTH AMERICA
- 5.1 Analysis of IT Load Capacity (MW) and Area footprint (Sq. Ft.) of Data Centers (for the Period of 2019-2031)
- 5.2 Analysis of Major Data Center Hotspots in North America
- 5.3 Analysis of Major Upcoming Hyperscale Facilities in North America
6 MARKET SIZE AND GROWTH FORECASTS (VALUE)
- 6.1 By Cooling Technology
- 6.1.1 Air-Based Cooling
- 6.1.1.1 CRAH
- 6.1.1.2 Chiller and Economizer
- 6.1.1.3 Cooling Tower (Direct, Indirect, Two-Stage)
- 6.1.1.4 Others
- 6.1.2 Liquid-Based Cooling
- 6.1.2.1 Immersion Cooling
- 6.1.2.2 Direct-to-Chip Cooling
- 6.1.2.3 Rear-Door Heat Exchanger
- 6.1.1 Air-Based Cooling
- 6.2 By Cooling Component
- 6.2.1 Computer-Room Air Handlers (CRAH/CRAC)
- 6.2.2 Chillers and Heat-Exchanger Units
- 6.2.3 Cooling Towers and Dry Coolers
- 6.2.4 Pumps and Valves
- 6.2.5 Control and Monitoring Software
- 6.3 By Tier Type
- 6.3.1 Tier 1 and 2
- 6.3.2 Tier 3
- 6.3.3 Tier 4
- 6.4 By Data Center Size
- 6.4.1 Small Data Center
- 6.4.2 Medium Data Center
- 6.4.3 Large Data Center
- 6.4.4 Hyperscale Data Center
- 6.5 By Data Center Type
- 6.5.1 Colocation Data Center
- 6.5.2 Hyperscalers Data Center/CSPs
- 6.5.3 Enterprise and Edge Data Center
- 6.6 By Country
- 6.6.1 United States
- 6.6.2 Canada
- 6.6.3 Mexico
7 COMPETITIVE LANDSCAPE
- 7.1 Market Share Analysis
- 7.2 Company Profiles (Includes Global Level Overview, Market Level Overview, Core Segments, Financials as Available, Strategic Information, Market Rank/Share, Products and Services, and Recent Developments)
- 7.2.1 Vertiv Group Corp.
- 7.2.2 Stulz GmbH
- 7.2.3 Schneider Electric SE
- 7.2.4 Rittal GmbH and Co. KG
- 7.2.5 Asetek A/S
- 7.2.6 Alfa Laval AB
- 7.2.7 Iceotope Technologies Ltd.
- 7.2.8 Green Revolution Cooling Inc.
- 7.2.9 Chilldyne Inc.
- 7.2.10 Airedale International Air-Conditioning Ltd.
- 7.2.11 Nortek Air Solutions LLC
- 7.2.12 Mitsubishi Electric Corporation
- 7.2.13 Johnson Controls International plc
- 7.2.14 Munters Group AB
- 7.2.15 Delta Electronics Inc.
- 7.2.16 Hewlett Packard Enterprise Company
- 7.2.17 IBM Corporation
- 7.2.18 Cisco Systems Inc.
- 7.2.19 LiquidStack Inc.
- 7.2.20 Submer Technologies, S.L.
- 7.2.21 CoolIT Systems Inc.
- 7.2.22 Trane Technologies plc
- 7.2.23 Super Micro Computer Inc.
8 MARKET OPPORTUNITIES AND FUTURE OUTLOOK
- 8.1 White-Space and Unmet-Need Assessment

