
PUBLISHER: Mordor Intelligence | PRODUCT CODE: 2044131

PUBLISHER: Mordor Intelligence | PRODUCT CODE: 2044131
United States Residential Real Estate - Market Share Analysis, Industry Trends & Statistics, Growth Forecasts (2026 - 2031)
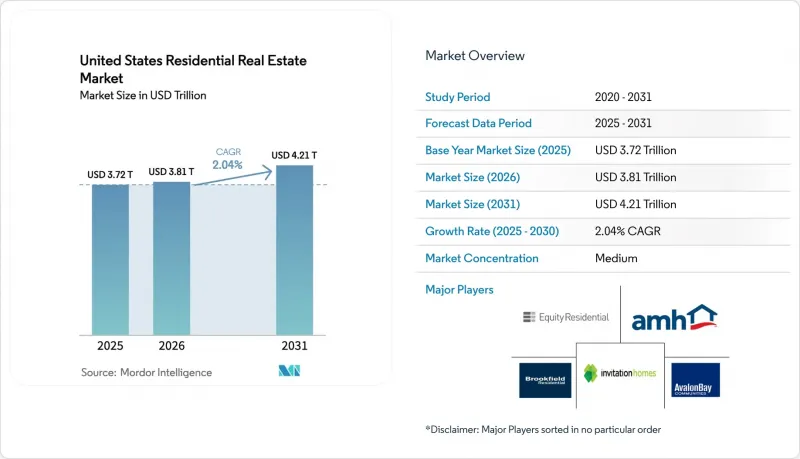
The United States Residential Real Estate Market size is estimated at USD 3.81 trillion in 2026, and is expected to reach USD 4.21 trillion by 2031, at a CAGR of 2.04% during the forecast period (2026-2031).
Easing mortgage rates late in 2025 and wage growth outpacing home price gains are improving affordability, which is stabilizing demand and supporting a gradual normalization of transaction activity. Pending home sales rose 3.3% month over month in November 2025, the strongest print in nearly three years, signaling the release of pent-up demand into early 2026. Supply remains tight because the mortgage lock-in effect continues to suppress resale listings even as builders add inventory and deploy incentives to defend volume in price-sensitive submarkets. Insurance costs have become a national headwind after a 21% year-over-year jump between 2023 and 2024, and rising premiums are especially burdensome in high-exposure geographies like Florida, where average annual costs now exceed USD 6,000.
United States Residential Real Estate Market Trends and Insights
Mortgage Rates Easing and Improving Affordability
The 30-year fixed mortgage rate averaged 6.15% in December 2025, which was the lowest monthly reading of the year and a notable improvement from late 2024 levels as monetary policy shifted toward easing. The Federal Reserve's rate cuts placed the policy range at 3.5-3.75% by December 2025, which anchored expectations for steadier borrowing costs into 2026 and reduced volatility for buyers and sellers in the US residential real estate market. Forecasts for 2026 indicate rates trending toward the high 5% range, which would expand the pool of qualified borrowers and support incremental gains in purchase applications. As wages outpace recent home price increases, payment-to-income ratios improve most in states with better alignment between incomes and medians such as Illinois and Texas, while affordability remains tighter in California and New York and is mixed in Florida due to insurance add-ons . The net effect is a gradual but broad-based lift in absorption that supports a measured recovery across the US residential real estate market in 2026
Pent-Up Demand Reflected In Rising Pending Sales
Pending home sales rose 3.3% month over month in November 2025 and reached their highest level in nearly three years, which signals a release of deferred demand into early 2026. Gains were broad-based across all four regions, pointing to a national rather than local inflection in buyer activity. Improved affordability and a modest expansion in active listings are giving buyers more options, and that is translating into higher contract signings. Purchase application trends and showing activity support a firmer transaction pipeline, which should lift closed sales as the U.S. residential real estate market transitions into the spring season. Even small rate declines can move marginal borrowers over approval thresholds, which boosts conversion and amplifies the near-term recovery in volumes.
Mortgage-Rate Lock-In Suppressing Listings and Mobility
An estimated 80% of mortgage borrowers hold rates below the December 2025 market average, which creates a powerful disincentive to list and repurchase at higher costs. Inventory remains 25% below pre-pandemic norms in many metros, and that tightness keeps prices firm despite slower volumes. The affordability gap for move-up or lateral buyers is material, and it functions as a de facto mobility tax that reduces turnover across age cohorts. Transaction chains that rely on move-down sellers are also affected, which constrains entry-level inventory in popular school districts and established neighborhoods. A durable easing in mortgage rates would alleviate this restraint, and some forecasts project rates closer to the high 5% range by late 2026, which would unlock more listings over time. Until then, the U.S. residential real estate market will contend with structurally low resale supply relative to demand.
Other drivers and restraints analyzed in the detailed report include:
- Builder Incentives and New-Home Supply Narrowing The Price Gap
- Wage growth outpacing home price gains supports absorption
- Insurance And Climate-Exposure Costs Reducing Affordability
For complete list of drivers and restraints, kindly check the Table Of Contents.
Segment Analysis
Apartments and condominiums captured 81.50% of total value in 2025, reflecting strong urban and inner-ring suburban demand that favors maintenance-free living, walkability, and proximity to employment centers. This concentration also mirrors the depth of institutional capital in multifamily formats and the scale benefits associated with professionally managed buildings. Developers are leaning into smaller average unit sizes and amenity-light formats that align with target rents, which supports occupancy and stabilizes absorption even as new deliveries crest in 2025-2026. Detached product remains relevant for family renters, and single-family rental communities have gained traction as a complementary path to meet household formation in growth corridors.
Builder incentives have narrowed the price gap with resales in several Sun Belt metros, which bolsters multifamily competitiveness in new-home communities that share school zones and commute sheds with established neighborhoods. Institutional developers continue to prioritize infill opportunities and transit-served sites in markets with durable job growth and supply constraints, which supports pricing over the forecast period. Zoning reforms that introduce missing-middle formats, including townhomes and small multiplexes, are expanding the attainable housing toolkit in select jurisdictions. These conditions position apartments and condominiums to remain the core of the U.S. residential real estate market through 2031, both as owner-occupied stock and as professionally managed rentals.
Sales comprised 78.55% in 2025 as ownership remains the default path for many households in Texas, California, Florida, New York, and Illinois as well as the Rest of US . Rate buydowns, smaller footprints, and targeted credits keep payments within reach, which helps the sales channel preserve volume during lock-in constrained periods in the US residential real estate market. Resales are limited by low listing flow, so builders and lenders coordinate closely to deliver certainty and speed for qualified buyers who prioritize new-home warranties and modern energy standards. The US residential real estate industry is also adapting workflow tools that streamline pre-approvals and closings, which support throughput during the 2026 normalization. These elements maintain sales primacy even as other channels gain share in the US residential real estate market.
Rental is projected to grow faster at a 2.29% CAGR through 2031 as single-family rental communities scale and professionally managed multifamily assets deliver location and service benefits across large metros in the US residential real estate market. Texas and Florida saw significant single-family rental community delivery in 2025, which moderated rent growth due to increased supply, while New York and Illinois multifamily maintained pricing power amid tighter pipelines. Institutional ownership of single-family rentals remains a minority of the total stock, which leaves room for consolidation and professionalization that can lift operating metrics over time. As affordability improves, some higher-income renters convert to ownership while lifestyle renters remain active in well-located communities, which supports a two-track expansion in the US residential real estate market. These patterns suggest durable rental growth as part of a balanced channel mix in the US residential real estate market.
The United States Residential Real Estate Market is Segmented by Property Type (Apartments and Condominiums, and Villas and Landed Houses), by Price Band (Affordable, Mid-Market and Luxury), by Business Model (Sales and Rental), by Mode of Sale (Primary and Secondary), and by States (Texas, California, Florida, New York, Illinois and Rest of US). The Market Forecasts are Provided in Terms of Value (USD)
List of Companies Covered in this Report:
- Greystar Real Estate Partners LLC
- Invitation Homes Inc.
- Equity Residential
- AvalonBay Communities Inc.
- American Homes 4 Rent
- Brookfield Residential Properties Inc.
- Lennar Corporation
- D.R. Horton Inc.
- PulteGroup Inc.
- KB Home
- Toll Brothers Inc.
- Mill Creek Residential Trust LLC
- Alliance Residential Company
- Lincoln Property Company
- The Michaels Organization
- Essex Property Trust Inc.
- Simon Property Group (Residential Arm)
- RE/MAX Holdings Inc.
- Keller Williams Realty Inc.
- Redfin Corporation
- Opendoor Technologies Inc.
Additional Benefits:
- The market estimate (ME) sheet in Excel format
- 3 months of analyst support
TABLE OF CONTENTS
1 Introduction
- 1.1 Study Assumptions & Market Definition
- 1.2 Scope of the Study
2 Research Methodology
3 Executive Summary
4 Market Landscape
- 4.1 Overview of the Economy and Market
- 4.2 Real Estate Buying Trends - Socioeconomic and Demographic Insights
- 4.3 Government Initiatives and Regulatory Aspects for the Residential Real Estate Sector
- 4.4 Focus on Technology Innovation, Startups, and PropTech in Real Estate
- 4.5 Insights into Rental Yields in Real Estate Segment
- 4.6 Real Estate Lending Dynamics
- 4.7 Insights Into Affordable Housing Support Provided by Government and Public-private Partnerships
- 4.8 Market Drivers
- 4.8.1 Accelerated Build-for-Rent Single-Family Demand in Sunbelt States
- 4.8.2 Surge in Remote-Work-Driven Migration to Second-Tier Metros
- 4.8.3 Institutional Capital Inflow via Residential REITs & PE Funds
- 4.8.4 Federal Incentives for Net-Zero & Energy-Efficient Homes
- 4.8.5 Technology-Enabled Sales Channels (iBuying, Fractional Ownership)
- 4.8.6 Demographic Tailwinds from Millennials Entering Prime Buying Years
- 4.9 Market Restraints
- 4.9.1 Mortgage-Rate Volatility Dampening Affordability
- 4.9.2 Construction-Labor Shortages & Escalating Material Costs
- 4.9.3 Local Zoning Restrictions Limiting New Supply
- 4.9.4 Rising Insurance Premiums in Climate-Risk Zones
- 4.10 Value / Supply-Chain Analysis
- 4.10.1 Overview
- 4.10.2 Real Estate Developers and Contractors - Key Quantitative and Qualitative Insights
- 4.10.3 Real Estate Brokers and Agents - Key Quantitative and Qualitative Insights
- 4.10.4 Property Management Companies - Key Quantitative and Qualitative Insights
- 4.10.5 Insights on Valuation Advisory and Other Real Estate Services
- 4.10.6 State of the Building Materials Industry and Partnerships with Key Developers
- 4.10.7 Insights on Key Strategic Real Estate Investors/Buyers in the Market
- 4.11 Porter's Five Forces
- 4.11.1 Threat of New Entrants
- 4.11.2 Bargaining Power of Buyers/Consumers
- 4.11.3 Bargaining Power of Suppliers
- 4.11.4 Threat of Substitute Products
- 4.11.5 Intensity of Competitive Rivalry
5 US Residential Real Estate Market Size & Growth Forecasts (Value)
- 5.1 Sales
- 5.2 Rental
6 US Residential Real Estate Market (Sales Model) Size & Growth Forecasts (Value)
- 6.1 By Property Type
- 6.1.1 Apartments & Condominiums
- 6.1.2 Villas & Landed Houses
- 6.2 By Price Band
- 6.2.1 Affordable
- 6.2.2 Mid-Market
- 6.2.3 Luxury
- 6.3 By Mode of Sale
- 6.3.1 Primary (New-Build)
- 6.3.2 Secondary (Existing-Home Resale)
- 6.4 By States
- 6.4.1 Texas
- 6.4.2 California
- 6.4.3 Florida
- 6.4.4 New York
- 6.4.5 Illinois
- 6.4.6 Rest of US
7 Competitive Landscape
- 7.1 Strategic Moves
- 7.2 Market Share Analysis
- 7.3 Company Profiles (includes Global level Overview, Market level overview, Core Segments, Financials as available, Strategic Information, Market Rank/Share for key companies, Products & Services, Recent Developments)
- 7.3.1 Greystar Real Estate Partners LLC
- 7.3.2 Invitation Homes Inc.
- 7.3.3 Equity Residential
- 7.3.4 AvalonBay Communities Inc.
- 7.3.5 American Homes 4 Rent
- 7.3.6 Brookfield Residential Properties Inc.
- 7.3.7 Lennar Corporation
- 7.3.8 D.R. Horton Inc.
- 7.3.9 PulteGroup Inc.
- 7.3.10 KB Home
- 7.3.11 Toll Brothers Inc.
- 7.3.12 Mill Creek Residential Trust LLC
- 7.3.13 Alliance Residential Company
- 7.3.14 Lincoln Property Company
- 7.3.15 The Michaels Organization
- 7.3.16 Essex Property Trust Inc.
- 7.3.17 Simon Property Group (Residential Arm)
- 7.3.18 RE/MAX Holdings Inc.
- 7.3.19 Keller Williams Realty Inc.
- 7.3.20 Redfin Corporation
- 7.3.21 Opendoor Technologies Inc.
8 Market Opportunities & Future Outlook
- 8.1 White-Space & Unmet-Need Assessment

