PUBLISHER: Mordor Intelligence | PRODUCT CODE: 2044210

PUBLISHER: Mordor Intelligence | PRODUCT CODE: 2044210
Virtual Reality In Gaming - Market Share Analysis, Industry Trends & Statistics, Growth Forecasts (2026 - 2031)
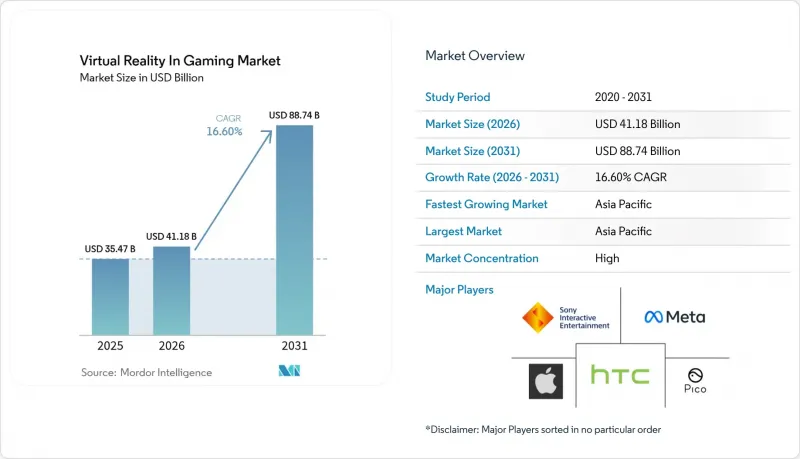
The Virtual Reality in Gaming market size was valued at USD 35.47 billion in 2025 and is estimated to grow from USD 41.18 billion in 2026 to reach USD 88.74 billion by 2031, at a CAGR of 16.6% during the forecast period (2026-2031). Surging telco-subsidized 5G edge-rendering bundles that push latency below 50 milliseconds, the entry of sub-USD 400 eye-tracking stand-alone headsets, and a pipeline of AAA franchises that now launch day-and-date in VR have all moved the category from experimental to mainstream. Location-based entertainment operators opened nearly thirty new venues across Asia-Pacific in 2025, confirming that commercial arcades are no longer niche pilots but scalable revenue engines. Cloud-streamed services such as NVIDIA GeForce NOW have shown that console-grade graphics can reach lightweight goggles over 5G, eroding the visual gap between tethered and mobile devices. Meanwhile, Meta's focus on subscription platforms like Supernatural demonstrates that recurring software revenue, rather than one-time hardware sales, is becoming the dominant value driver.
Global Virtual Reality In Gaming Market Trends and Insights
Influx of AAA VR-Exclusive Franchises Re-energizing Upgrade Cycles
High-profile titles such as Microsoft Flight Simulator 2024's upcoming PSVR2 edition and cross-platform releases including The Boys VR and Titan Isles are moving from one-off experiments to native VR builds, weaving haptic feedback and foveated rendering into core game loops. Sony's 2025 PSVR2 price cut from USD 549 to USD 399 converted millions of existing PlayStation 5 owners into addressable VR buyers. Meta matched this momentum with the USD 299 Quest 3S, which added eye-tracking and high-resolution passthrough at entry-level pricing. Early-access preorders for marquee VR titles in 2025 out-paced their flat-screen counterparts by roughly 20%, indicating that exclusive content now materially influences hardware refresh decisions.
Expansion of Location-Based VR Arcades in Tier-1 Asian Cities
Sandbox VR surpassed USD 200 million in 2025 revenue and opened 29 new venues across Shenzhen, Tokyo, Seoul, and Singapore, offering premium sessions at USD 30-60 per hour. China's arcade density in major metros hit one site per 100,000 residents, signaling mainstream appeal. Venues deploy enterprise-grade headsets with wider fields of view and full-body haptic suits, thereby elevating consumer expectations and nudging hardware makers toward higher baselines even for home devices. The commercial segment's willingness to pay top-tier rates for social experiences is establishing a durable revenue pillar beside at-home spending.
Motion-Sickness-Driven Refund Rates Curtailing Average Session Lengths
Approximately 40% to 70% of first-time VR users report symptoms of motion sickness-nausea, disorientation, eye strain-within the first 20 to 30 minutes of gameplay, leading to elevated product returns and negative word-of-mouth that deters subsequent purchases. Retailers in the United States and Europe logged headset return rates of 15-20% in 2025, triple the rate for standard gaming hardware. The churn forces manufacturers to boost refresh rates and integrate comfort algorithms, inflating bills of materials by USD 50-80 and squeezing margins just as hardware prices drop.
Other drivers and restraints analyzed in the detailed report include:
- 5G Edge-Rendering Bundles from Telcos Slashing Latency Barriers
- Sub-USD 400 Eye-Tracking Stand-Alone Headsets Unlocking Emerging-Market Adoption
- Pancake-Lens Supply Bottlenecks Restricting Stand-Alone Shipments
For complete list of drivers and restraints, kindly check the Table Of Contents.
Segment Analysis
Hardware generated 70.64% of Virtual Reality in Gaming market revenue in 2025 as first-time adopters purchased headsets, controllers, and sensors. Average selling prices have already dropped 30% since the Quest 2 launch, indicating hardware commoditization. Meanwhile, content and services are forecast to deliver a 16.72% CAGR through 2031. This switch shows that ecosystem stickiness now hinges on libraries like Supernatural, which surpassed 1 million paid subscribers, and social worlds that thrive on microtransactions.
OpenXR 1.0's broad adoption cuts porting cost by roughly one-third, letting indie studios target several storefronts at once. As a result, attach rates rose from 3.2 titles per headset in 2024 to 4.1 in 2025, confirming that software spend accelerates once initial hardware barriers fall. Location-based operators strengthen this flywheel by paying recurring license fees for premium multiplayer experiences, widening the services pie of the Virtual Reality in Gaming market.
Stand-alone goggles accounted for 56.82% of 2025 revenue and remain the entry point for many new gamers, especially given Meta's 74.6% share of that slice. Yet cloud and streaming VR, helped by Deutsche Telekom's GeForce NOW deployment, is projected at a 17.09% CAGR. These services demonstrate that console-quality visuals can be delivered wirelessly when the user is within a sub-60-millisecond 5G footprint.
PC tethered rigs, once the apex of fidelity, are losing ground as Snapdragon XR2 Gen 2-class chips narrow the gap. Console-based VR benefits from Sony's deep game catalog but still faces cable-management friction. The market is polarizing into low-cost stand-alone devices and cloud-leaning play, shrinking the mid-range that once defined high-end home VR.
The Virtual Reality in Gaming Market Report is Segmented by Component (Hardware, Software, and More), Device Type (PC and Desktop-Tethered, Gaming Console, and More), Hardware Category (Head-Mounted Displays, Gesture-Tracking Devices, and More), Game Genre (Action and Shooter, Racing and Simulation, and More), End-User (Individual and Home, and More), and Geography. The Market Forecasts are Provided in Terms of Value (USD).
Geography Analysis
Asia-Pacific led the Virtual Reality in Gaming market with a 39.86% share in 2025 and is projected to post a 17.15% CAGR to 2031. China's arcade density exceeded one venue per 100,000 citizens in Beijing and Shenzhen, underlining mass acceptance. South Korea's 5G network, reaching sub-25 millisecond round-trip times, underpins cloud-rendered multiplayer that needs no local GPU muscle. India's cafe model offers USD 6-10 per hour access to metro consumers who cannot yet justify a USD 299 headset, providing an on-ramp to future home ownership.
North America retains a huge installed base-over 15 million headsets-spurred by deep AAA content pipelines across California, Washington, and Texas. Yet elevated return rates tied to motion discomfort compel manufacturers to invest in comfort tweaks, adding USD 50-80 per unit in materials. Mexico's accelerating broadband speeds and rising middle class make it a prime follower market for sub-USD 400 devices.
Europe shows a two-speed pattern. Germany, the United Kingdom, and France ride EU immersive-content tax rebates that subsidize development, while Southern and Eastern markets lag due to lower disposable incomes. Telia and Telenor's Nordic edge nodes have reproduced the South Korean latency blueprint, signaling that cloud VR can flourish in high-bandwidth but cost-conscious settings. The Middle East focuses on destination-grade attractions, exemplified by Dubai's 2,000-square-meter VR zone launched in early 2025.
List of Companies Covered in this Report:
- Meta Platforms Inc. (Oculus)
- Sony Interactive Entertainment LLC
- HTC Corporation
- Valve Corporation
- Pico Interactive (ByteDance)
- Microsoft Corporation
- Nintendo Co., Ltd.
- Google LLC
- Samsung Electronics Co., Ltd.
- Apple Inc.
- Qualcomm Technologies Inc.
- Lenovo Group Ltd.
- Xiaomi Corporation
- bHaptics Inc.
- Virtuix Inc.
- TESLASUIT / VR Electronics Ltd.
- DPVR
- Pimax Innovation Inc.
- Magic Leap Inc.
- Xreal (Nreal)
- HP Inc.
Additional Benefits:
- The market estimate (ME) sheet in Excel format
- 3 months of analyst support
TABLE OF CONTENTS
1 INTRODUCTION
- 1.1 Study Assumptions & Market Definition
- 1.2 Scope of the Study
2 RESEARCH METHODOLOGY
3 EXECUTIVE SUMMARY
4 MARKET LANDSCAPE
- 4.1 Market Overview
- 4.2 Market Drivers
- 4.2.1 Influx of AAA VR-Exclusive Franchises Re-energising Upgrade Cycles in North America and Europe
- 4.2.2 Expansion of Location-Based VR Arcades in Tier-1 Asian Cities Driving Commercial Headset Demand
- 4.2.3 5G-Edge Rendering Bundles from Telcos in South Korea and Nordics Slashing Latency Barriers
- 4.2.4 Sub-USD-400 Eye-Tracking Stand-Alone Headsets Unlocking Emerging-Market Adoption
- 4.2.5 OpenXR and Khronos Interoperability Standards Lowering Porting Costs for Developers
- 4.2.6 EU Immersive-Content Tax Rebates Fueling Premium VR Game Pipelines in France and Germany
- 4.3 Market Restraints
- 4.3.1 Motion-Sickness-Driven Refund Rates Curtailing Average Session Lengths
- 4.3.2 Pancake-Lens Supply Bottlenecks Restricting Stand-Alone Shipments
- 4.3.3 Strict Health-Safety Certification for Vertigo Risks in Japan Raising Compliance Costs
- 4.3.4 Mobile Mixed-Reality Titles Cannibalising Premium-Mobile VR in North America
- 4.4 Value Chain Analysis
- 4.5 Regulatory Outlook
- 4.6 Technological Outlook
- 4.7 Porter's Five Forces
- 4.7.1 Threat of New Entrants
- 4.7.2 Bargaining Power of Buyers
- 4.7.3 Bargaining Power of Suppliers
- 4.7.4 Threat of Substitutes
- 4.7.5 Intensity of Competitive Rivalry
- 4.8 Pricing Analysis
- 4.9 Comparative Study: AR-Led vs VR-Led Gaming Engagement
- 4.10 Popular VR Game Themes and Leading Publishers
5 MARKET SIZE AND GROWTH FORECASTS (VALUE)
- 5.1 By Component
- 5.1.1 Hardware
- 5.1.2 Software
- 5.1.3 Content / Services
- 5.2 By Device Type
- 5.2.1 PC / Desktop-Tethered
- 5.2.2 Gaming Console
- 5.2.3 Stand-Alone Headsets
- 5.2.4 Premium Mobile
- 5.2.5 Cloud / Streaming VR
- 5.3 By Hardware Category
- 5.3.1 Head-Mounted Displays (HMDs)
- 5.3.2 Gesture-Tracking Devices (GTDs)
- 5.3.3 VR Accessories (Haptics Treadmills Vests)
- 5.3.4 VR Cameras and 360 Capture
- 5.4 By Game Genre
- 5.4.1 Action and Shooter
- 5.4.2 Racing and Simulation
- 5.4.3 Adventure and Role-Playing
- 5.4.4 Horror and Puzzle
- 5.4.5 Sports and Fitness
- 5.4.6 Social / Multiplayer Worlds
- 5.5 By End-user
- 5.5.1 Individual / Home
- 5.5.2 Commercial Arcades and LBE
- 5.5.3 Esports and Competitive Gaming Venues
- 5.5.4 Educational and Training Institutions
- 5.6 By Geography
- 5.6.1 North America
- 5.6.1.1 United States
- 5.6.1.2 Canada
- 5.6.1.3 Mexico
- 5.6.2 South America
- 5.6.2.1 Brazil
- 5.6.2.2 Argentina
- 5.6.2.3 Rest of South America
- 5.6.3 Europe
- 5.6.3.1 Germany
- 5.6.3.2 United Kingdom
- 5.6.3.3 France
- 5.6.3.4 Spain
- 5.6.3.5 Rest of Europe
- 5.6.4 Asia-Pacific
- 5.6.4.1 China
- 5.6.4.2 India
- 5.6.4.3 Japan
- 5.6.4.4 South Korea
- 5.6.4.5 ASEAN
- 5.6.4.6 Rest of Asia-Pacific
- 5.6.5 Middle East
- 5.6.5.1 Saudi Arabia
- 5.6.5.2 United Arab Emirates
- 5.6.5.3 Turkey
- 5.6.5.4 Rest of Middle East
- 5.6.6 Africa
- 5.6.6.1 South Africa
- 5.6.6.2 Egypt
- 5.6.6.3 Rest of Africa
- 5.6.1 North America
6 COMPETITIVE LANDSCAPE
- 6.1 Market Concentration
- 6.2 Strategic Moves
- 6.3 Market Share Analysis
- 6.4 Company Profiles {(includes Global level Overview, Market level overview, Core Segments, Financials as available, Strategic Information, Market Rank/Share for key companies, Products & Services, and Recent Developments)}
- 6.4.1 Meta Platforms Inc. (Oculus)
- 6.4.2 Sony Interactive Entertainment LLC
- 6.4.3 HTC Corporation
- 6.4.4 Valve Corporation
- 6.4.5 Pico Interactive (ByteDance)
- 6.4.6 Microsoft Corporation
- 6.4.7 Nintendo Co., Ltd.
- 6.4.8 Google LLC
- 6.4.9 Samsung Electronics Co., Ltd.
- 6.4.10 Apple Inc.
- 6.4.11 Qualcomm Technologies Inc.
- 6.4.12 Lenovo Group Ltd.
- 6.4.13 Xiaomi Corporation
- 6.4.14 bHaptics Inc.
- 6.4.15 Virtuix Inc.
- 6.4.16 TESLASUIT / VR Electronics Ltd.
- 6.4.17 DPVR
- 6.4.18 Pimax Innovation Inc.
- 6.4.19 Magic Leap Inc.
- 6.4.20 Xreal (Nreal)
- 6.4.21 HP Inc.
7 MARKET OPPORTUNITIES AND FUTURE OUTLOOK
- 7.1 White-Space & Unmet-Need Assessment

