
PUBLISHER: Mordor Intelligence | PRODUCT CODE: 2061529

PUBLISHER: Mordor Intelligence | PRODUCT CODE: 2061529
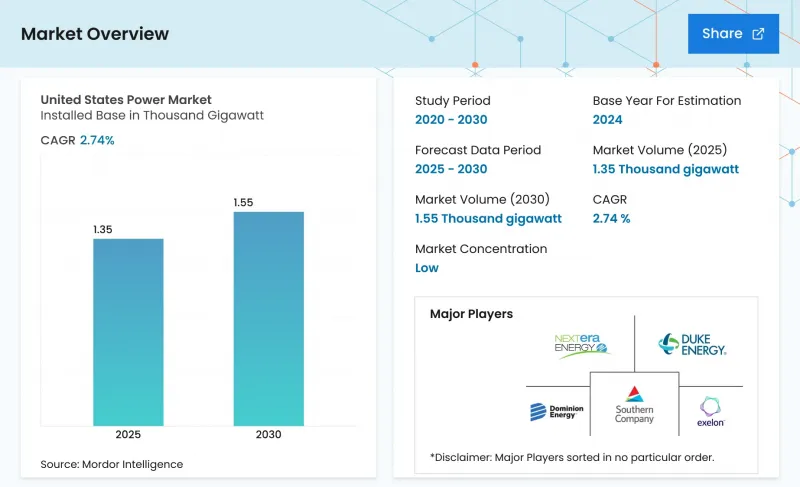
United States Power - Market Share Analysis, Industry Trends & Statistics, Growth Forecasts (2026 - 2031)
According to Mordor Intelligence, the united states power market size in terms of installed base is expected to grow from 1.35 Thousand gigawatt in 2025 to 1.39 Thousand gigawatt in 2026 and is forecast to reach 1.59 Thousand gigawatt by 2031 at 2.73% CAGR over 2026-2031.
This report is Segmented by Power Source (Thermal, Nuclear, and Renewables) and End-User (Utilities, Commercial and Industrial, and Residential). The Market Sizes and Forecasts are Provided in Terms of Installed Capacity (GW).
United States Power Market Trends and Insights
IRA-driven renewable build-out
The IRA's decade-long extension of production and investment tax credits, plus a 20-percentage-point domestic-content bonus, has shifted capital decisively toward wind and solar projects. Announcements totaling 550 GW of renewable capacity for delivery by 2030 already exceed pre-IRA forecasts twofold. Contracted offtake now covers more than 80% of projects announced in 2024 as financiers demand revenue certainty. U.S. module producer First Solar is expanding its Ohio manufacturing to 14 GW of annual output by 2026, ensuring a compliant supply. However, a looming 2029-2030 credit step-down is expected to compress construction schedules and bid up equipment costs.
Coal Retirements Create Capacity Gap
Roughly 20 GW of coal capacity scheduled to exit by 2030 is concentrated in PJM, MISO, and SPP. With capacity auctions clearing at record prices, utilities are pairing solar, wind, and 4-hour batteries rather than building new gas turbines. Duke Energy alone budgeted USD 400 million in 2024 for environmental retrofits to keep marginal coal units online until replacement resources interconnect. Interconnection backlogs averaging five years intensify the gap, forcing grid operators to activate emergency demand-response programs. These dynamics elevate both reliability risk and merchant-generator opportunity.
Solar or transformer supply bottlenecks
High-voltage transformer lead times lengthened to 30 months in 2024 versus 12 months pre-pandemic, delaying interconnections and network upgrades. Domestic production capacity of roughly 200 units annually meets only half of the current demand. ABB and Hitachi Energy announced U.S. factory expansions, but full output is unlikely before 2027. Section 201 solar tariffs and forced-labor import bans inflated compliant-module prices by up to 20%, compressing developer returns. Utilities now sign multi-year supply agreements with escalators, shifting inflation risk to customers.
Other drivers and restraints analyzed in the detailed report include:
- Electrification-led demand growth
- Grid Modernization & Resiliency Funding
- Transmission Siting & Permitting Delays
For complete list of drivers and restraints, kindly check the Table Of Contents.
Segment Analysis
Renewables captured 42.4% of installed capacity in 2024 and are advancing at a 7.8% CAGR, steadily eroding thermal's majority position in the United States power market. Utility-scale solar additions of 32 GW in 2024 outpaced every other technology for the third straight year, while the 800 MW Vineyard Wind 1 project heralded commercial offshore wind entry. Coal retirements removed 8 GW in 2024, pushing average fleet capacity factors below 40% and increasing reliance on flexible gas assets for ramping. Nuclear capacity remains steady near 95 GW; the planned 835 MW restart of Three Mile Island in 2028 marks the first reactor return from retirement and underscores nuclear's role in firm zero-carbon supply. Emerging geothermal projects such as Fervo's 400 MW Project Red illustrate growing investor appetite for dispatchable renewables.
Investment momentum favors technologies with clear IRA incentives, positioning solar-plus-storage and wind as the default replacements for retiring fossil units within the United States power market. Developers nonetheless face interconnection delays, transformer shortages, and tariff exposure that add price volatility. Natural-gas combined-cycle builds are slowing as potential methane fees loom, yet existing gas fleets continue to capture scarcity rents during evening peaks. Small modular reactors earned Nuclear Regulatory Commission design approval in 2024, but commercial operation remains a post-2030 prospect. Biomass and tidal remain niche as environmental compliance costs outweigh revenue streams.
List of Companies Covered in this Report:
- NextEra Energy Inc
- American Electric Power
- FirstEnergy Corp
- Constellation Energy
- Mitsubishi Power Americas
- Duke Energy Corp
- Berkshire Hathaway Energy
- Public Service Enterprise Group
- Pattern Energy Group
- Southern Company
- Vistra Corp
- AES Corporation
- Orsted A/S (US)
- ABB USA
- Exelon Corp
- Entergy Corp
- Eversource Energy
- General Electric Vernova
- Toshiba America Energy Systems
Additional Benefits:
- The market estimate (ME) sheet in Excel format
- 3 months of analyst support
TABLE OF CONTENTS
1 Introduction
- 1.1 Study Assumptions & Market Definition
- 1.2 Scope of the Study
2 Research Methodology
3 Executive Summary
4 Market Landscape
- 4.1 Market Overview
- 4.2 Market Drivers
- 4.2.1 IRA-driven renewable build-out
- 4.2.2 Coal retirements create capacity gap
- 4.2.3 Electrification-led demand growth
- 4.2.4 Grid modernization & resiliency funding
- 4.2.5 Hyperscale-data-center PPAs
- 4.2.6 Green-hydrogen electrolyzer demand
- 4.3 Market Restraints
- 4.3.1 Solar/transformer supply bottlenecks
- 4.3.2 Transmission siting & permitting delays
- 4.3.3 Curtailment risk in high-renewable zones
- 4.3.4 Extreme-weather insurance cost surge
- 4.4 Supply-Chain Analysis
- 4.5 Regulatory Landscape
- 4.6 Technological Outlook
- 4.7 Porter's Five Forces
- 4.7.1 Threat of New Entrants
- 4.7.2 Bargaining Power of Suppliers
- 4.7.3 Bargaining Power of Buyers
- 4.7.4 Threat of Substitutes
- 4.7.5 Competitive Rivalry
- 4.8 PESTLE Analysis
5 Market Size & Growth Forecasts
- 5.1 By Power Source
- 5.1.1 Thermal (Coal, Natural Gas, Oil and Diesel)
- 5.1.2 Nuclear
- 5.1.3 Renewables (Solar, Wind, Hydro, Geothermal, Biomass & Waste, Tidal)
- 5.2 By End User
- 5.2.1 Utilities
- 5.2.2 Commercial and Industrial
- 5.2.3 Residential
- 5.3 By T&D Voltage Level (Qualitative Analysis only)
- 5.3.1 High-Voltage Transmission (Above 230 kV)
- 5.3.2 Sub-Transmission (69 to 161 kV)
- 5.3.3 Medium-Voltage Distribution (13.2 to 34.5 kV)
- 5.3.4 Low-Voltage Distribution (Up to 1 kV)
6 Competitive Landscape
- 6.1 Market Concentration
- 6.2 Strategic Moves (M&A, Partnerships, PPAs)
- 6.3 Market Share Analysis (Market Rank/Share for key companies)
- 6.4 Company Profiles (includes Global level Overview, Market level overview, Core Segments, Financials as available, Strategic Information, Products & Services, and Recent Developments)
- 6.4.1 NextEra Energy Inc
- 6.4.2 American Electric Power
- 6.4.3 FirstEnergy Corp
- 6.4.4 Constellation Energy
- 6.4.5 Mitsubishi Power Americas
- 6.4.6 Duke Energy Corp
- 6.4.7 Berkshire Hathaway Energy
- 6.4.8 Public Service Enterprise Group
- 6.4.9 Pattern Energy Group
- 6.4.10 Southern Company
- 6.4.11 Vistra Corp
- 6.4.12 AES Corporation
- 6.4.13 Orsted A/S (US)
- 6.4.14 ABB USA
- 6.4.15 Exelon Corp
- 6.4.16 Entergy Corp
- 6.4.17 Eversource Energy
- 6.4.18 General Electric Vernova
- 6.4.19 Toshiba America Energy Systems
7 Market Opportunities & Future Outlook
- 7.1 White-space & Unmet-Need Assessment

