
PUBLISHER: Mordor Intelligence | PRODUCT CODE: 2066394

PUBLISHER: Mordor Intelligence | PRODUCT CODE: 2066394
China Power - Market Share Analysis, Industry Trends & Statistics, Growth Forecasts (2026 - 2031)
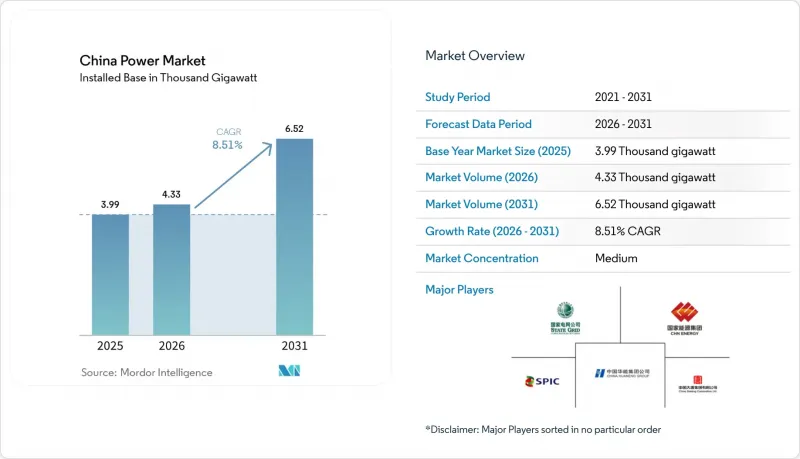
According to Mordor Intelligence, the china power market size is expected to grow from 3.99 Thousand gigawatt in 2025 to 4.33 Thousand gigawatt in 2026 and is forecast to reach 6.52 Thousand gigawatt by 2031 at 8.51% CAGR over 2026-2031.
This report is Segmented by Power Source (Thermal, Nuclear, and Renewables) and End-User (Utilities, Commercial and Industrial, and Residential). The Market Sizes and Forecasts are Provided in Terms of Installed Capacity (GW).
China Power Market Trends and Insights
Accelerated Grid-Parity Solar Auctions Drive Market Transformation
Mandatory competitive bidding from 2025 replaces feed-in tariffs, compelling developers to price entirely on economics while retaining regional flexibility in auction design. The policy arrives amid manufacturing overcapacity in panels, nudging weaker firms out and encouraging consolidation. Simultaneously, spot-price exposure drives interest in storage-coupled projects that flatten revenue risk, positioning the Chinese power market for deeper merchant activity.
Provincial Renewable Portfolio Standards Enforce Clean-Energy Mandates
Mandatory quotas backed by a fast-growing green-certificate market, 327% trading-volume growth in 2024, tie provincial energy-intensity goals to renewable procurement. Resource-rich western provinces monetize excess generation by selling certificates to demand-heavy coastal hubs, stimulating cross-regional flows and distributed solar uptake.
Stranded-Asset Risks Challenge Coal-Dependent Regions
Accelerated retirement and reduced dispatch hours threaten balance-sheet health for state generators and local economies reliant on coal. Financial scrutiny is rising as lenders factor carbon prices and lower capacity factors into credit terms. Coordinating exit schedules with replacement resources remains critical for winter-heating reliability.
Other drivers and restraints analyzed in the detailed report include:
- Carbon-Neutral Roadmap Accelerates Coal-Plant Retirement Schedules
- Industrial Electrification Expands Beyond Traditional Applications
- Renewable Energy Curtailment Constrains Western Development
For complete list of drivers and restraints, kindly check the Table Of Contents.
Segment Analysis
Renewables held 53.78% of the capacity in 2025, and their share of the China power market size is on track to exceed 65.7% by 2031 as additions compound at a 12.12% CAGR. Solar capacity alone climbed to 842 GW in 2024, following another 300 GW surge, with N-type TOPCon modules outpacing PERC variants in cost-performance metrics. Offshore wind in Jiangsu, Guangdong, and Fujian now hosts 45 GW; 18 MW machines deliver capacity factors above 55%, trimming levelized costs to CNY 0.30 per kWh. Hydro sits near its ecological ceiling of 420 GW, so incremental pumped-storage is the primary growth vector, targeting 100 GW by 2030. Biomass, geothermal, and tidal remain below 50 GW combined due to feedstock and site limits.
Thermal capacity accounts for 39.5% of China's power market share, yet coal still supplies 60% of the country's generation, given higher utilization rates. Natural-gas units now total 130 GW, expanding at a rate of 5.84% annually to meet peaking demand, despite LNG prices exceeding USD 12 per million British thermal units (mmBtu). Nuclear, at 57 GW in 2024, benefits from 24 reactors under construction and 11 new approvals, driving a path toward 150 GW by 2035 with a capacity factor of over 90%. Oil and diesel remain marginal, restricted to islanded grids and backup roles.
List of Companies Covered in this Report:
- State Grid Corporation of China
- China Huaneng Group Co. Ltd.
- China Energy Investment Corp (CHN Energy)
- China Huadian Corporation Ltd.
- China Datang Corporation Ltd.
- State Power Investment Corp (SPIC)
- China Three Gorges Corporation
- China General Nuclear Power Group
- China Southern Power Grid Company
- Shanghai Electric Group Co Ltd
- Xinjiang Goldwind Science & Technology Co Ltd
- Longi Green Energy Technology Co Ltd
- JinkoSolar Holding Co Ltd
- MingYang Smart Energy Group Ltd
- TBEA Co Ltd
- Pinggao Group Co Ltd
- Suntech Power Co Ltd
- Envision Energy Ltd
- China Yangtze Power Co Ltd
- China National Electric Engineering Co Ltd
- Sinovel Wind Group Co Ltd
- Datang International Power Generation Co Ltd
Additional Benefits:
- The market estimate (ME) sheet in Excel format
- 3 months of analyst support
TABLE OF CONTENTS
1 Introduction
- 1.1 Study Assumptions & Market Definition
- 1.2 Scope of the Study
2 Research Methodology
3 Executive Summary
4 Market Landscape
- 4.1 Market Overview
- 4.2 Market Drivers
- 4.2.1 Accelerated Grid-Parity Solar Auctions (China Mainland)
- 4.2.2 Provincial Renewable Portfolio Quota (RPS) Compliance
- 4.2.3 Carbon-Neutral 2060 Roadmap Reshaping Capacity Mix
- 4.2.4 Electrification of Transport & Process Heat Boosting Load
- 4.2.5 Spot Market & Capacity-Payment Pilots Improving ROI
- 4.2.6 Green-Bond-Fuelled Low-Cost Project Finance
- 4.3 Market Restraints
- 4.3.1 Stranded-Asset Risk from Coal Retirements
- 4.3.2 Renewables Curtailment in Remote Provinces
- 4.3.3 Land-Use & Ecological Caps on Mega Hydro/Wind
- 4.3.4 Retail-Tariff Ceilings Limiting Cost Pass-Through
- 4.4 Supply-Chain Analysis
- 4.5 Regulatory Landscape
- 4.6 Technological Outlook
- 4.7 Porter's Five Forces
- 4.7.1 Threat of New Entrants
- 4.7.2 Threat of Substitutes
- 4.7.3 Bargaining Power of Buyers
- 4.7.4 Bargaining Power of Suppliers
- 4.7.5 Competitive Rivalry
- 4.8 PESTLE Analysis
5 Market Size & Growth Forecasts
- 5.1 By Power Source
- 5.1.1 Thermal (Coal, Natural Gas, Oil and Diesel)
- 5.1.2 Nuclear
- 5.1.3 Renewables (Solar, Wind, Hydro, Geothermal, Biomass & Waste, Tidal)
- 5.2 By End User
- 5.2.1 Utilities
- 5.2.2 Commercial and Industrial
- 5.2.3 Residential
- 5.3 By T&D Voltage Level (Qualitative Analysis only)
- 5.3.1 High-Voltage Transmission (Above 230 kV)
- 5.3.2 Sub-Transmission (69 to 161 kV)
- 5.3.3 Medium-Voltage Distribution (13.2 to 34.5 kV)
- 5.3.4 Low-Voltage Distribution (Up to 1 kV)
6 Competitive Landscape
- 6.1 Market Concentration
- 6.2 Strategic Moves (M&A, Partnerships, PPAs)
- 6.3 Market Share Analysis (Market Rank/Share for key companies)
- 6.4 Company Profiles (includes Global level Overview, Market level overview, Core Segments, Financials as available, Strategic Information, Products & Services, and Recent Developments)
- 6.4.1 State Grid Corporation of China
- 6.4.2 China Huaneng Group Co. Ltd.
- 6.4.3 China Energy Investment Corp (CHN Energy)
- 6.4.4 China Huadian Corporation Ltd.
- 6.4.5 China Datang Corporation Ltd.
- 6.4.6 State Power Investment Corp (SPIC)
- 6.4.7 China Three Gorges Corporation
- 6.4.8 China General Nuclear Power Group
- 6.4.9 China Southern Power Grid Company
- 6.4.10 Shanghai Electric Group Co Ltd
- 6.4.11 Xinjiang Goldwind Science & Technology Co Ltd
- 6.4.12 Longi Green Energy Technology Co Ltd
- 6.4.13 JinkoSolar Holding Co Ltd
- 6.4.14 MingYang Smart Energy Group Ltd
- 6.4.15 TBEA Co Ltd
- 6.4.16 Pinggao Group Co Ltd
- 6.4.17 Suntech Power Co Ltd
- 6.4.18 Envision Energy Ltd
- 6.4.19 China Yangtze Power Co Ltd
- 6.4.20 China National Electric Engineering Co Ltd
- 6.4.21 Sinovel Wind Group Co Ltd
- 6.4.22 Datang International Power Generation Co Ltd
7 Market Opportunities & Future Outlook
- 7.1 White-Space & Unmet-Need Assessment

