
PUBLISHER: Mordor Intelligence | PRODUCT CODE: 2061582

PUBLISHER: Mordor Intelligence | PRODUCT CODE: 2061582
Seismic Services - Market Share Analysis, Industry Trends & Statistics, Growth Forecasts (2026 - 2031)
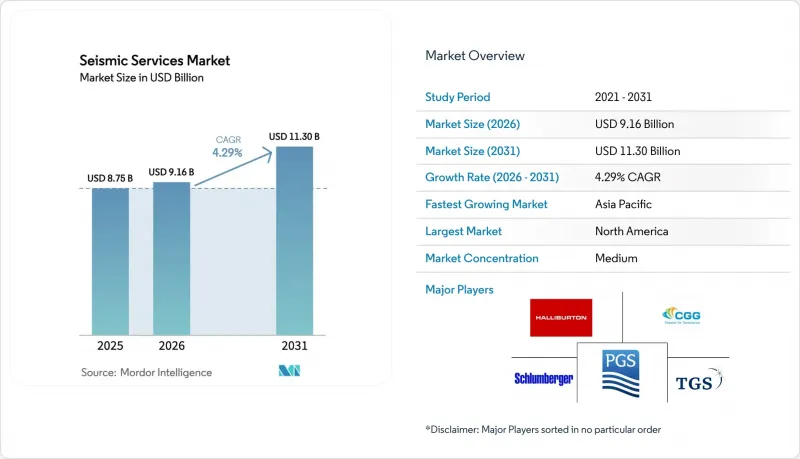
According to Mordor Intelligence, the seismic services market size is expected to increase from USD 8.75 billion in 2025 to USD 9.16 billion in 2026 and reach USD 11.30 billion by 2031, growing at a CAGR of 4.29% over 2026-2031.
This report is Segmented by Service (Data Acquisition and Data Processing and Interpretation), Seismic Technology (2D Seismic, 3D Seismic, 4D/Time-Lapse Seismic, and Ocean-Bottom Node Seismic), Deployment Location (Onshore and Offshore), Application (Oil and Gas, Offshore Energy and Marine, CCUS, Mining and Mineral Exploration, and More), and Geography (North America, Europe, Asia-Pacific, and More).
Global Seismic Services Market Trends and Insights
Rebound in Offshore E&P Spending
Global upstream outlays touched roughly USD 570 billion in 2025, yet the 6% reduction in overall oil spending confirms that only the highest-margin deepwater prospects received incremental capital. Saudi Aramco's 17,000 square-kilometer 3D program over the Jafurah unconventional gas field and ADNOC's salt-structure imaging campaigns typify the pivot toward complex, high-value reservoirs. Because many vessels remain tethered to the Gulf of Mexico and North Sea, service companies must increasingly redeploy fleets into the Middle East and Asia-Pacific, raising repositioning costs and execution risk. This geographic concentration intensifies competition for crews capable of acquiring wide-azimuth, long-offset data in logistically challenging waters. The outcome is a bifurcated seismic services market where premium assets earn strong day rates while older vessels stay cold-stacked.
Deployment of 4D Time-Lapse Seismic
The International Association of Oil & Gas Producers released new repeatability guidelines in December 2024 that reduced acquisition uncertainty and catalyzed wider adoption of permanent monitoring arrays. BP's Thunder Horse OBN installation and regulator-mandated monitoring at North Sea CCS sites demonstrate that 4D imaging is now routine for both hydrocarbon optimization and carbon storage assurance. TGS and Shearwater GeoServices secured multi-year frame agreements in 2025 to execute baseline and monitor surveys, ensuring recurring revenue streams that are less cyclical than exploration campaigns. Incremental recovery of just 2% across a 1 billion-barrel field can finance node arrays costing USD 100 million, yet adoption remains limited in frontier provinces where appraisal drilling competes for funds. As more CCS hubs enter the operational phase, mandatory annual 3D or biennial 4D surveys are set to lock in long-term contracts, smoothing the revenue profile for data owners.
Capex Reallocation to Renewables
Shell, BP, and TotalEnergies each shifted more than 20% of their 2025 upstream budgets toward renewable assets, a move that directly reduced seismic line items across European portfolios. Equinor spent USD 2.3 billion on offshore wind in the North Sea and U.S. Atlantic, diverting funds that traditionally financed North Sea 4D programs. Investor activism and regulatory decarbonization mandates are amplifying this migration of capital, and even some national oil companies are evaluating hydrogen investments. The consequence is a smaller pool of discretionary exploration spending, lowering the potential size of new multi-client programs and increasing reliance on pre-funding. Asian and Middle Eastern NOCs partially offset the reduction, yet the geographic rebalancing raises currency risk and lengthens sales cycles for data library owners.
Other drivers and restraints analyzed in the detailed report include:
- NOC Expansion into Deepwater Frontiers
- Offshore Wind Site Assessment Demand
- Strict Marine Noise Regulations
For complete list of drivers and restraints, kindly check the Table Of Contents.
Segment Analysis
Data Acquisition accounted for 65.8% of 2025 revenue within the seismic services market, illustrating the capital intensity of streamer spreads, land crews, and OBN fleets. Multi-year acquisition projects in Brazil, China, and Saudi Arabia keep vessel utilization above 80% for modern crews, supporting a stable backlog. Yet Data Processing and Interpretation is forecast to grow at a 5.3% CAGR through 2031, propelled by cloud platforms such as CGG's GeoSoftware and SLB's Delfi that shorten delivery cycles and embed AI-driven attribute extraction. Operators increasingly award integrated contracts that bundle acquisition with analytics, favoring providers capable of delivering end-to-end workflows. Small-scale processing houses without cloud capabilities risk marginalization as clients insist on real-time project dashboards, automated quality control, and machine-learning tomography. The continuous expansion of legacy data libraries further enlarges the seismic services market size for reprocessing, reservoir characterization, and carbon storage feasibility studies.
Providers emphasize elastic compute, containerized algorithms, and subscription licenses to shift revenue models from project billing toward recurring software services. Data residency laws in Europe and the Middle East require regional data centers, prompting alliances with hyperscale cloud firms. As machine-learning inversion, facies classification, and automated fault picking mature, value capture migrates up the stack, compressing acquisition margins but elevating software gross profit. The combined effect is a gradual but irreversible redistribution of the seismic services market toward digital services.
3D Seismic held 41.3% of the seismic services market share in 2025, remaining indispensable for deepwater imaging beneath salt, basalt, and complex overburden. Wide-azimuth configurations and longer offsets dominate new programs in Brazil's Santos Basin and Guyana's Stabroek block. Meanwhile, 4D/Time-Lapse Seismic exhibits the fastest expansion, at a projected 7.1% CAGR to 2031, underpinned by mandatory surveillance of CO2 plume migration at North Sea and Gulf Coast storage sites. Ocean-bottom nodes with battery lives surpassing 180 days support both 3D baseline and 4D monitor acquisitions, effectively creating a single technology ecosystem that serves production optimization and emission mitigation. The convergence heightens capital efficiency for contractors owning adaptable OBN inventories, further enlarging addressable revenue.
2D Seismic retains relevance for reconnaissance in frontier provinces such as the Arctic Barents Sea, where Geoex completed a regional grid in 2025, but its share of overall spend continues to shrink. Regulators now expect higher-resolution submissions in licensing applications, accelerating the shift from 2D to 3D or sparse OBN designs. The combination of rising regulation, deepwater complexity, and CCS oversight reshapes the technology mix in favor of high-density arrays, securing long-term growth for the seismic services market.
Geography Analysis
North America held 36.7% of the seismic services market revenue in 2025, propelled by Gulf of Mexico deepwater developments and Canadian Atlantic prospects, despite a drop in U.S. shale permitting. The U.S. Inflation Reduction Act incentivized new CCS surveys along the Gulf Coast, while Canada's Clean Fuel Standard attracted seismic programs targeting saline aquifers in Alberta. NOAA's stricter acoustic criteria elevated compliance costs, yet the abundance of existing infrastructure and advanced processing hubs keeps the region attractive for integrated contractors. Cloud connectivity and data residency requirements have encouraged partnerships between seismic firms and hyperscale cloud providers, bolstering digital processing share within the seismic services market.
Asia-Pacific is projected to log a 9.9% CAGR to 2031, the fastest globally. CNOOC's Bohai Bay initiatives, ONGC's Krishna-Godavari campaigns, and Woodside's Scarborough gas project ensure continuous demand for long-offset imaging. Southeast Asian governments are reviving acreage offerings with gas-to-power ambitions, producing a pipeline of 2D reconnaissance and 3D appraisal work. Regulatory regimes remain less prescriptive than in Europe, but local content and environmental requirements are tightening, making joint ventures with domestic crews advantageous. A young fleet of Chinese-owned vessels increases regional competition yet broadens overall capacity, fostering competitive day rates that nevertheless sustain the expansion of the seismic services market.
Europe maintains a mature yet technologically advanced landscape: Norway and the UK drive 4D and OBN uptake for legacy fields and CCS clusters, while Denmark and Germany mobilize shallow-water seismic for offshore wind. EU noise directives and CO2 monitoring regulations extend the operational runway for high-end geophysics. South America benefits from Petrobras's sustained pre-salt investment and ExxonMobil's ongoing Guyana program, both reliant on high-density node surveys. Fiscal instability occasionally stalls licensing rounds, but multiyear commitments from IOCs and NOCs maintain baseline demand. The Middle East and Africa, powered by Saudi Aramco, ADNOC, and emerging Namibia discoveries, deliver large, multi-season acquisition campaigns. Government mandates for domestic processing capacity and data sovereignty encourage joint ventures, expanding the seismic services market through localized value chains.
- Schlumberger NV
- Halliburton Company
- CGG SA
- PGS ASA
- TGS ASA
- Shearwater GeoServices Holding AS
- China Oilfield Services Ltd (COSL)
- BGP Inc. CNPC
- SAExploration Holdings Inc.
- SeaBird Exploration PLC
- Fugro NV
- Magseis Fairfield ASA
- ION Geophysical Corp.
- PXGEO
- STRYDE Ltd.
- INOVA Geophysical
- Sercel (CGG Group)
- Fairfield Geotechnologies
- Geoex Ltd.
- WesternGeco (SLB)
Additional Benefits:
- The market estimate (ME) sheet in Excel format
- 3 months of analyst support
TABLE OF CONTENTS
1 Introduction
- 1.1 Study Assumptions & Market Definition
- 1.2 Scope of the Study
2 Research Methodology
3 Executive Summary
4 Market Landscape
- 4.1 Market Overview
- 4.2 Market Drivers
- 4.2.1 Rebound in offshore E&P spending
- 4.2.2 Deployment of 4D time-lapse seismic
- 4.2.3 NOC expansion into deep-water frontiers
- 4.2.4 Offshore-wind site assessment demand
- 4.2.5 Fiber-optic DAS for permanent monitoring
- 4.2.6 CCS project surveillance requirements
- 4.3 Market Restraints
- 4.3.1 Capex re-allocation to renewables
- 4.3.2 Strict marine-noise regulations
- 4.3.3 Shrinking multi-client funding pool
- 4.3.4 High debt load of vessel owners
- 4.4 Supply-Chain Analysis
- 4.5 Regulatory Landscape
- 4.6 Technological Outlook
- 4.7 Porter's Five Forces
- 4.7.1 Bargaining Power of Suppliers
- 4.7.2 Bargaining Power of Buyers
- 4.7.3 Threat of New Entrants
- 4.7.4 Threat of Substitutes
- 4.7.5 Intensity of Rivalry
5 Market Size & Growth Forecasts
- 5.1 By Service
- 5.1.1 Data Acquisition
- 5.1.2 Data Processing and Interpretation
- 5.2 By Seismic Technology
- 5.2.1 2D Seismic
- 5.2.2 3D Seismic
- 5.2.3 4D/Time-Lapse Seismic
- 5.2.4 Ocean-Bottom Node (OBN) Seismic
- 5.3 By Deployment Location
- 5.3.1 Onshore
- 5.3.2 Offshore
- 5.4 By Application
- 5.4.1 Oil and Gas
- 5.4.2 Offshore Energy and Marine
- 5.4.3 Carbon Capture, Utilization and Storage (CCUS)
- 5.4.4 Mining and Mineral Exploration
- 5.4.5 Geothermal Energy
- 5.4.6 Civil Engineering and Infrastructure
- 5.4.7 Others (Natural Hazard Assessment, Environmental Studies, and Academic & Research)
- 5.5 By Geography
- 5.5.1 North America
- 5.5.2 Europe
- 5.5.3 Asia-Pacific
- 5.5.4 South America
- 5.5.5 Middle East and Africa
6 Competitive Landscape
- 6.1 Market Concentration
- 6.2 Strategic Moves (M&A, Partnerships, PPAs)
- 6.3 Market Share Analysis (Market Rank/Share for key companies)
- 6.4 Company Profiles (includes Global level Overview, Market level overview, Core Segments, Financials as available, Strategic Information, Products & Services, and Recent Developments)
- 6.4.1 Schlumberger NV
- 6.4.2 Halliburton Company
- 6.4.3 CGG SA
- 6.4.4 PGS ASA
- 6.4.5 TGS ASA
- 6.4.6 Shearwater GeoServices Holding AS
- 6.4.7 China Oilfield Services Ltd (COSL)
- 6.4.8 BGP Inc. CNPC
- 6.4.9 SAExploration Holdings Inc.
- 6.4.10 SeaBird Exploration PLC
- 6.4.11 Fugro NV
- 6.4.12 Magseis Fairfield ASA
- 6.4.13 ION Geophysical Corp.
- 6.4.14 PXGEO
- 6.4.15 STRYDE Ltd.
- 6.4.16 INOVA Geophysical
- 6.4.17 Sercel (CGG Group)
- 6.4.18 Fairfield Geotechnologies
- 6.4.19 Geoex Ltd.
- 6.4.20 WesternGeco (SLB)
7 Market Opportunities & Future Outlook
- 7.1 White-space & Unmet-Need Assessment

