
PUBLISHER: Mordor Intelligence | PRODUCT CODE: 2061632

PUBLISHER: Mordor Intelligence | PRODUCT CODE: 2061632
Offshore Wind Energy - Market Share Analysis, Industry Trends & Statistics, Growth Forecasts (2026 - 2031)
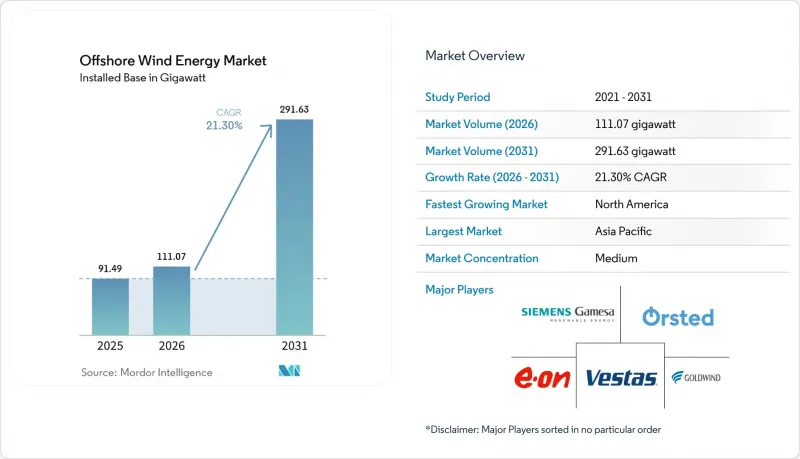
According to Mordor Intelligence, the offshore wind energy market size was valued at 91.49 gigawatt in 2025 and estimated to grow from 111.07 gigawatt in 2026 to reach 291.63 gigawatt by 2031, at a CAGR of 21.30% during the forecast period (2026-2031).
This report is Segmented by Foundation Type (Fixed and Floating), Turbine Capacity (Up To 3 MW, 3 To 6 MW, and Above 6 MW), Application (Utility-Scale, Commercial and Industrial, and Community Projects), and Geography (North America, Europe, Asia-Pacific, South America, and Middle East and Africa). The Market Sizes and Forecasts are Provided in Terms of Installed Capacity (GW).
Global Offshore Wind Energy Market Trends and Insights
Rapid decline in LCOE drives market acceleration
Costs have crossed a critical threshold: at USD 0.075/kWh in 2024, new arrays equal or beat combined-cycle gas plants on price in multiple regions. Higher-rated turbines, serial fabrication, and shorter installation windows cut overall project timelines by up to 30% and materially improve developer returns. Floating projects once deemed uneconomic are approaching breakeven as learning curves trim capex and as global insurers underwrite deeper-water risks. Consensus among equipment vendors places sub-USD 0.060/kWh pricing within reach this decade, solidifying the offshore wind energy market as a go-to baseload-like renewable option.
Government auction mechanisms accelerate deployment
Competitive tenders awarded 23.2 GW across Europe in 2024 alone, a 40% year-on-year leap that extended predictable cash-flow regimes for twenty years or more. Denmark's record-low clearing price signaled confidence in supply-chain maturity, while Japan's latest 1.8 GW tranche showcased Asia's appetite for turnkey solutions. Germany strengthens the model by synchronizing grid build-out obligations with award announcements, reducing curtailment risk and lifting bankability.
Shortage of installation vessels constrains growth
Fewer than fifty jack-up and heavy-lift ships can erect 15 MW turbines worldwide, pushing day-rates to USD 500,000-700,000 and risking 12- to 24-month delays in crowded construction seasons. The Jones Act tightens supply further by capping foreign-flag work inside U.S. waters, so developers are experimenting with feeder-barge concepts and modular assembly to stay on schedule.
Other drivers and restraints analyzed in the detailed report include:
- Turbine upsizing transforms project economics
- Corporate PPAs reshape demand dynamics
- Grid connection infrastructure lags development
For complete list of drivers and restraints, kindly check the Table Of Contents.
Segment Analysis
Fixed platforms secured 99.62% of installations in 2025, reflecting proven fabricator networks and installation speeds suited to 60-m depths. This configuration underpins core projects across the offshore wind energy market, but monopile diameter is approaching practical limits as turbines surpass 15 MW. Jackets remain essential in rocky seabeds, while gravity and suction solutions service niche geological settings.
Floating (semi-submersibles, spar-buoys, and tension-leg) platforms are scaling at a 42.1% CAGR, opening 100-m-plus depths where winds blow steadier and permitting hurdles to ease. Hywind Scotland's 65% capacity factor validates the economics of deep-water generation. California, South Korea, and Japan now run floating-only lease rounds, creating tailwinds that could lift the floating slice of the offshore wind energy market to double digits by decade-end.
Geography Analysis
Asia-Pacific sat atop the offshore wind energy market with 54.35% share in 2025, propelled by China's 35 GW fleet and 20 MW domestic turbines that roll off increasingly automated lines. Japan's 1.8 GW Round 3 opened deep waters to European and U.S. developers, and Taiwan's Phase 3 feed-in model shows resilience despite grid delays. Vietnam, India, and Australia are crafting seabed-leasing frameworks that could unlock substantial pipelines by the early 2030s.
North America posts the fastest growth curve at 103.6% CAGR. The 30 GW U.S. federal goal is backed by streamlined Bureau of Ocean Energy Management (BOEM) timelines, state solicitations totaling 17 GW, and domestic vessel construction that shields the supply chain from currency shocks. Canada eyes Atlantic and Pacific leases after mapping more than 4,000 GW of technical potential, while Mexico and Brazil assess wind regimes ahead of potential auctions.
Europe retains technological leadership even as its market share dips. A 12 GW UK procurement queue, Germany's innovation auctions, and Denmark's record-low prices underscore the region's depth. Developers now look to floating turbines in the Celtic Sea, Norway's Utsira Nord, and Spain's Canary Islands to tap higher-yield sites and sustain export-oriented supply hubs.
- Siemens Gamesa Renewable Energy SA
- Vestas Wind Systems AS
- GE Vernova (GE Renewable Energy)
- Xinjiang Goldwind Science & Technology Co Ltd
- Ming Yang Smart Energy Group Ltd.
- Shanghai Electric Wind Power
- Nordex SE
- China Three Gorges Corp.
- State Power Investment Corp. (SPIC)
- Envision Energy Ltd.
- Orsted AS
- Equinor ASA
- Northland Power Inc.
- EDF SA
- E.ON SE
- RWE AG
- Iberdrola SA
- Copenhagen Infrastructure Partners
- BP plc
- TotalEnergies SE
- Shell plc
- Dominion Energy
- Ocean Winds (EDP & Engie JV)
Additional Benefits:
- The market estimate (ME) sheet in Excel format
- 3 months of analyst support
TABLE OF CONTENTS
1 Introduction
- 1.1 Study Assumptions & Market Definition
- 1.2 Scope of the Report
2 Research Methodology
3 Executive Summary
4 Market Landscape
- 4.1 Market Overview
- 4.2 Market Drivers
- 4.2.1 Rapid decline in LCOE
- 4.2.2 Government auction schemes & FITs
- 4.2.3 Turbine upsizing to 15 MW+
- 4.2.4 Corporate PPAs for renewables
- 4.2.5 Repowering of first-wave farms post-2030
- 4.2.6 Offshore-to-hydrogen hybrid projects
- 4.3 Market Restraints
- 4.3.1 Shortage of installation vessels
- 4.3.2 Grid-connection bottlenecks
- 4.3.3 Seabed-mineral rights conflicts
- 4.3.4 Limited O&M workforce pool
- 4.4 Supply-Chain Analysis
- 4.5 Regulatory Landscape
- 4.6 Technological Outlook
- 4.7 Porters Five Forces
- 4.7.1 Bargaining Power of Suppliers
- 4.7.2 Bargaining Power of Buyers
- 4.7.3 Threat of New Entrants
- 4.7.4 Threat of Substitutes
- 4.7.5 Intensity of Competitive Rivalry
5 Market Size & Growth Forecasts
- 5.1 By Foundation Type
- 5.1.1 Fixed
- 5.1.1.1 Monopile
- 5.1.1.2 Jacket
- 5.1.1.3 Gravity-Based
- 5.1.1.4 Tripod/Tripile
- 5.1.1.5 Suction Bucket
- 5.1.2 Floating
- 5.1.2.1 Semi-submersible
- 5.1.2.2 Spar-Buoy
- 5.1.2.3 Tension-Leg Platform (TLP)
- 5.1.2.4 Barge
- 5.1.1 Fixed
- 5.2 By Turbine Capacity
- 5.2.1 Up to 3 MW
- 5.2.2 3 to 6 MW
- 5.2.3 Above 6 MW
- 5.3 By Application
- 5.3.1 Utility-scale
- 5.3.2 Commercial and Industrial
- 5.3.3 Community Projects
- 5.4 By Component (Qualitative Analysis)
- 5.4.1 Nacelle/Turbine
- 5.4.2 Blade
- 5.4.3 Tower
- 5.4.4 Generator and Gearbox
- 5.4.5 Foundations
- 5.4.6 Balance-of-System
- 5.4.7 Others (Installation, Vessels, O&M)
- 5.5 By Geography
- 5.5.1 North America
- 5.5.1.1 United States
- 5.5.1.2 Rest of North America
- 5.5.2 Europe
- 5.5.2.1 Germany
- 5.5.2.2 France
- 5.5.2.3 United Kingdom
- 5.5.2.4 Spain
- 5.5.2.5 NORDIC Countries
- 5.5.2.6 Italy
- 5.5.2.7 Netherlands
- 5.5.2.8 Belgium
- 5.5.2.9 Rest of Europe
- 5.5.3 Asia-Pacific
- 5.5.3.1 China
- 5.5.3.2 India
- 5.5.3.3 Japan
- 5.5.3.4 South Korea
- 5.5.3.5 Vietnam
- 5.5.3.6 Rest of Asia-Pacific
- 5.5.4 South America
- 5.5.4.1 Brazil
- 5.5.4.2 Argentina
- 5.5.4.3 Rest of South America
- 5.5.5 Middle East and Africa
- 5.5.5.1 Saudi Arabia
- 5.5.5.2 United Arab Emirates
- 5.5.5.3 South Africa
- 5.5.5.4 Rest of Middle East and Africa
- 5.5.1 North America
6 Competitive Landscape
- 6.1 Market Concentration
- 6.2 Strategic Moves (M&A, Partnerships, PPAs)
- 6.3 Market Share Analysis (Market Rank/Share for key companies)
- 6.4 Company Profiles (includes Global level Overview, Market level overview, Core Segments, Financials as available, Strategic Information, Products & Services, and Recent Developments)
- 6.4.1 Siemens Gamesa Renewable Energy SA
- 6.4.2 Vestas Wind Systems AS
- 6.4.3 GE Vernova (GE Renewable Energy)
- 6.4.4 Xinjiang Goldwind Science & Technology Co Ltd
- 6.4.5 Ming Yang Smart Energy Group Ltd.
- 6.4.6 Shanghai Electric Wind Power
- 6.4.7 Nordex SE
- 6.4.8 China Three Gorges Corp.
- 6.4.9 State Power Investment Corp. (SPIC)
- 6.4.10 Envision Energy Ltd.
- 6.4.11 Orsted AS
- 6.4.12 Equinor ASA
- 6.4.13 Northland Power Inc.
- 6.4.14 EDF SA
- 6.4.15 E.ON SE
- 6.4.16 RWE AG
- 6.4.17 Iberdrola SA
- 6.4.18 Copenhagen Infrastructure Partners
- 6.4.19 BP plc
- 6.4.20 TotalEnergies SE
- 6.4.21 Shell plc
- 6.4.22 Dominion Energy
- 6.4.23 Ocean Winds (EDP & Engie JV)
7 Market Opportunities & Future Outlook
- 7.1 White-space & Unmet-need Assessment

