
PUBLISHER: Mordor Intelligence | PRODUCT CODE: 2062156

PUBLISHER: Mordor Intelligence | PRODUCT CODE: 2062156
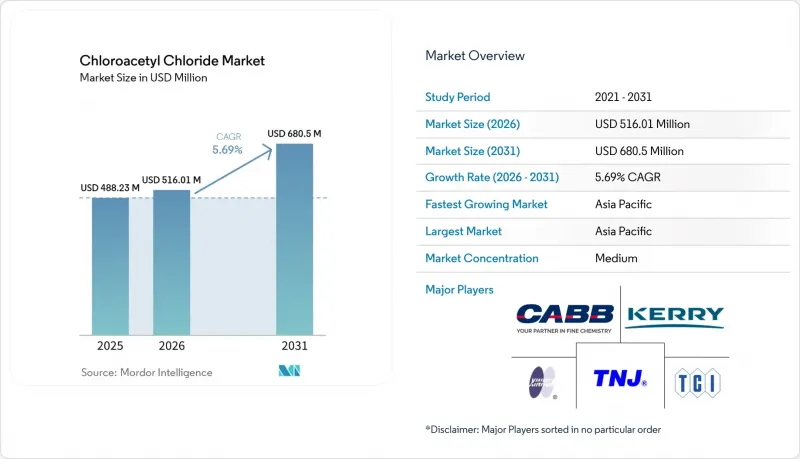
Chloroacetyl Chloride - Market Share Analysis, Industry Trends & Statistics, Growth Forecasts (2026 - 2031)
According to Mordor Intelligence, the chloroacetyl chloride market size is projected to expand from USD 488.23 million in 2025 and USD 516.01 million in 2026 to USD 680.5 million by 2031, registering a CAGR of 5.69% between 2026 to 2031.
This report is Segmented by Purity/Grade (95-99% (Industrial Grade) and More), Application (Herbicides, Plant Growth Regulators and Safeners, and More), End-User Industry (Agrochemical Manufacturing, Pharmaceutical and Biotech, and More), and Geography (Asia-Pacific, North America, Europe, South America, and Middle-East and Africa). The Market Forecasts are Provided in Terms of Value (USD).
Global Chloroacetyl Chloride Market Trends and Insights
Escalating Pharmaceutical API Outsourcing to India and China
India's production-linked incentive scheme, with an allocation of USD 830 million, supports 53 bulk drugs and 215 starting materials through 2025. This has resulted in the establishment of several greenfield chlorination units. In 2025, Laxmi Organic invested USD 22 million to expand its capacity for acetyl intermediates, focusing on anti-diabetic and anti-hypertensive active pharmaceutical ingredients (APIs). In 2024, Shandong Xinhua invested USD 275 million in research and development (R&D) to enhance continuous-process routes, achieving a 40% reduction in cycle time. To address geopolitical risks, major Western pharmaceutical companies are now sourcing chlorinated building blocks from both India and China. This transition has shifted 70% of volumes previously produced in Europe or North America. Additionally, there is a significant increase in capacity certified to current Good Manufacturing Practices (cGMP) and International Organization for Standardization (ISO) 9001 standards, ensuring sustained demand through 2031.
Capacity Expansion Momentum Among Asian Producers
Shivtek Spechemi plans to increase its Indian production capacity from 150,000 tons per year (tpy) to 650,000 tons per year (tpy) by 2029. This expansion will involve two new plants located on an 8-acre parcel adjacent to Bodal's Rajpura chlor-alkali site. The site provides access to pipeline chlorine and reduces logistics costs by 30%. In Thailand, AGC Vinythai's caustic soda production expansion in 2026 will double its polyvinyl chloride (PVC) output and generate a chlorine by-product for downstream chlorinated intermediates. Electricity tariffs in Asia are 40% lower compared to Europe, where companies such as Fortischem, Spolana, and Arkema have ceased operations due to high gas prices. This cost difference positions the Asia-Pacific region as a key export hub through 2031.
Volatile Chlorine and Acetic-Acid Feedstock Prices
In March 2026, acetic acid spot prices ranged between USD 450-550 per ton across key regions. European chlorine prices exceeded USD 220 per ton due to capacity closures. For non-integrated producers, a USD 50 per ton increase in either feedstock results in a 6-8% rise in production costs. Pipeline chlorine agreements, such as the Shivtek-Bodal deal, and backward integration into acetic acid help mitigate some risks. However, earnings before interest, taxes, depreciation, and amortization (EBITDA) for smaller players can still fluctuate by 15-20% within a quarter.
Other drivers and restraints analyzed in the detailed report include:
- Shift Toward Continuous-Flow Chlorination
- Emergence of Photo-Acid Generators for EUV Lithography
- Hazardous-Waste Disposal Bottlenecks in Emerging Markets
For complete list of drivers and restraints, kindly check the Table Of Contents.
Segment Analysis
In 2025, industrial-grade material accounted for 55.11% of the chloroacetyl chloride market, addressing the requirements of cost-focused agrochemical producers. Meanwhile, high-purity grade is projected to grow at a 5.77% compound annual growth rate (CAGR) through 2031, driven by manufacturers in the United States, Taiwan, and South Korea, who require metallic impurities below 10 parts per billion (ppb). Tokyo Chemical Industry and Merck KGaA, through proprietary distillation, control over 99% of the supply, while Chinese competitors, utilizing continuous-flow reactors, achieve 98.5% purity at a competitive cost.
Semiconductor-related orders contribute directly to higher profit margins: the installation of each extreme ultraviolet (EUV) tool increases annual demand by 1.5-2 tons for materials with a purity of 99.5% or higher, and after 2027, High-NA upgrades are expected to double material usage per wafer. In contrast, the technical grade, which serves the dye and pigment industries, is experiencing slower growth. As manufacturers impose stricter impurity limits, the gap in purity levels is anticipated to widen, supporting price premiums for ultra-high-purity materials while maintaining stable demand for the cost-efficient industrial grade.
Geography Analysis
In 2025, the Asia-Pacific region held a 50.89% share of the chloroacetyl chloride market and is projected to grow at a 6.03% CAGR from 2026 to 2031. In 2025, the region accounted for over half of the global volume. Countries like China, India, Japan, and South Korea benefit from low power costs and an integrated chlor-alkali feed, ensuring the region's profitability in the chloroacetyl chloride market. Additionally, strategies like continuous-flow retrofits, pipeline chlorine deals, and export-oriented tax incentives strengthen this competitive position.
In North America, brownfield semiconductor projects in states like Arizona, Ohio, and Texas are driving demand for chloroacetyl chloride, especially for grades of 99.5% purity and above. While stringent hazardous-material regulations and higher labor costs moderate domestic output in the United States, free-trade agreements with Mexican toll producers ensure a balanced and secure supply. Furthermore, Jayhawk's acquisition by an Indian entity introduces an Asia-linked cost advantage to its U.S. manufacturing, combining cost efficiency with strategic proximity.
Europe's growth depends on investments in emission-control measures. For instance, CABB's EUR 50 million upgrade in Kokkola reduces chlorine consumption and complies with the Industrial Emissions Directive. However, challenges like European gas price volatility and a shrinking chlor-alkali base limit long-term growth. Meanwhile, South America and the Middle East account for less than 10% of global revenues but offer supply flexibility. For example, Qatar Vinyl's chlorine stream could potentially support a chlorinated-intermediate hub on the Gulf Coast, catering to Africa's growing agrochemical market.
- Angene International
- Anhui Guangxin Agrochemical
- CABB Group GmbH
- Hefei TNJ Chemical Industry Co.,Ltd.
- Kerry Group plc.
- Laxmi Organic Industries
- Merck KGaA
- Modi Chemical
- Shandong Xinhua Pharma
- Shanghai Worldyang Chemical Co., Ltd.
- Shiva Pharmachem Ltd.
- Tokyo Chemical Industry Co.,Ltd.
- Weishi County Xinbo Fine Chemical
- Yufeng International Group Co., Ltd.
- Zhejiang Yongtai Technology
Additional Benefits:
- The market estimate (ME) sheet in Excel format
- 3 months of analyst support
TABLE OF CONTENTS
1 Introduction
- 1.1 Study Assumptions and Market Definition
- 1.2 Scope of the Study
2 Research Methodology
3 Executive Summary
4 Market Landscape
- 4.1 Market Overview
- 4.2 Market Drivers
- 4.2.1 Escalating pharmaceutical API outsourcing to India and China
- 4.2.2 Capacity expansion momentum among Chinese and Indian bulk-chlorination producers
- 4.2.3 Shift toward continuous-flow chlorination lowering unit costs
- 4.2.4 Emergence of photo-acid generators for EUV lithography
- 4.2.5 Rising captive consumption in specialty surfactants (quats, betaines)
- 4.3 Market Restraints
- 4.3.1 Volatile chlorine and acetic-acid feedstock prices
- 4.3.2 Hazardous-waste disposal bottlenecks in emerging markets
- 4.3.3 Insurance-premium spikes for chlorinated-acid facilities
- 4.4 Value Chain Analysis
- 4.5 Porter's Five Forces Analysis
- 4.5.1 Bargaining Power of Suppliers
- 4.5.2 Bargaining Power of Buyers
- 4.5.3 Threat of New Entrants
- 4.5.4 Threat of Substitutes
- 4.5.5 Competitive Rivalry
5 Market Size and Growth Forecasts (Value)
- 5.1 By Purity/Grade
- 5.1.1 95-99% (Industrial Grade)
- 5.1.2 Greater than or equal to 99% (High-Purity Grade)
- 5.1.3 Less than 95% (Technical Grade)
- 5.2 By Application
- 5.2.1 Herbicides (e.g., Dichloroacetanilide)
- 5.2.2 Plant Growth Regulators and Safeners
- 5.2.3 Pharmaceutical Intermediates (e.g., Thioacetazone)
- 5.2.4 Dyes and Pigments Precursors
- 5.2.5 Fragrances and Flavors Intermediates
- 5.2.6 Photographic and Imaging Chemicals
- 5.2.7 Specialty Surfactants and Quats
- 5.2.8 Others
- 5.3 By End-user Industry
- 5.3.1 Agrochemical Manufacturing
- 5.3.2 Pharmaceutical and Biotech
- 5.3.3 Fine and Specialty Chemical
- 5.3.4 Dye and Pigment
- 5.3.5 Fragrance and Flavor Houses
- 5.3.6 Others
- 5.4 By Geography
- 5.4.1 Asia-Pacific
- 5.4.1.1 China
- 5.4.1.2 India
- 5.4.1.3 Japan
- 5.4.1.4 South Korea
- 5.4.1.5 ASEAN Countries
- 5.4.1.6 Rest of Asia-Pacific
- 5.4.2 North America
- 5.4.2.1 United States
- 5.4.2.2 Canada
- 5.4.2.3 Mexico
- 5.4.3 Europe
- 5.4.3.1 Germany
- 5.4.3.2 France
- 5.4.3.3 United Kingdom
- 5.4.3.4 Italy
- 5.4.3.5 Spain
- 5.4.3.6 Russia
- 5.4.3.7 NORDIC Countries
- 5.4.3.8 Rest of Europe
- 5.4.4 South America
- 5.4.4.1 Brazil
- 5.4.4.2 Argentina
- 5.4.4.3 Rest of South America
- 5.4.5 Middle-East and Africa
- 5.4.5.1 Saudi Arabia
- 5.4.5.2 South Africa
- 5.4.5.3 Rest of Middle-East and Africa
- 5.4.1 Asia-Pacific
6 Competitive Landscape
- 6.1 Market Concentration
- 6.2 Strategic Moves
- 6.3 Market Share(%)/Ranking Analysis
- 6.4 Company Profiles (includes Global Overview, Market Overview, Core Segments, Financials, Strategic Information, Products and Services, and Recent Developments)
- 6.4.1 Angene International
- 6.4.2 Anhui Guangxin Agrochemical
- 6.4.3 CABB Group GmbH
- 6.4.4 Hefei TNJ Chemical Industry Co.,Ltd.
- 6.4.5 Kerry Group plc.
- 6.4.6 Laxmi Organic Industries
- 6.4.7 Merck KGaA
- 6.4.8 Modi Chemical
- 6.4.9 Shandong Xinhua Pharma
- 6.4.10 Shanghai Worldyang Chemical Co., Ltd.
- 6.4.11 Shiva Pharmachem Ltd.
- 6.4.12 Tokyo Chemical Industry Co.,Ltd.
- 6.4.13 Weishi County Xinbo Fine Chemical
- 6.4.14 Yufeng International Group Co., Ltd.
- 6.4.15 Zhejiang Yongtai Technology
7 Market Opportunities and Future Outlook
- 7.1 White-space and Unmet-need Assessment

