
PUBLISHER: Mordor Intelligence | PRODUCT CODE: 2062470

PUBLISHER: Mordor Intelligence | PRODUCT CODE: 2062470
Commercial and Industrial Energy Storage - Market Share Analysis, Industry Trends & Statistics, Growth Forecasts (2026 - 2031)
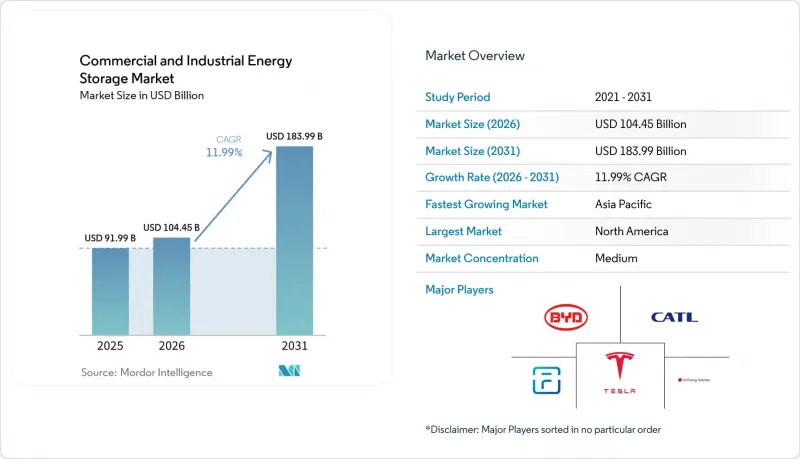
According to Mordor Intelligence, the commercial and industrial energy storage market size is expected to increase from USD 91.99 billion in 2025 to USD 104.45 billion in 2026 and reach USD 183.99 billion by 2031, growing at a CAGR of 11.99% over 2026-2031.
This report is Segmented by Technology (Lithium-Ion, Sodium-Ion, Lead-Acid, Flow Batteries, and Others), Application (Peak Shaving, Load Shifting, Backup Power/UPS, and More), End-User (Commercial Building, Data Centers, and More), and Geography (North America, Asia-Pacific, Europe, South America, and Middle East and Africa). Market Forecasts are Provided in Value (USD).
Global Commercial and Industrial Energy Storage Market Trends and Insights
Li-ion Cost Curve Approaching Sub-USD 90/kWh
Stationary battery pack prices averaged USD 70 per kWh in 2025, a 35% drop from 2020, crossing the point where three-to-five-year paybacks become common for commercial facilities in high-tariff regions. Manufacturing scale in China and the pivot to cobalt-free LFP chemistries have trimmed material costs by up to 20%. Lower capex broadens the addressable base from hyperscale users to mid-sized industrial plants, stimulating fresh demand for the commercial and industrial energy storage market. Major supply contracts, such as LG Energy Solution's USD 4.3 billion LFP deal with Tesla, signal sustained downward pricing over the next 18 months. Pilot lines for sodium-ion and early solid-state designs are expected to push average installed costs beneath USD 350 per kWh by late 2026, deepening penetration across cost-sensitive sectors.
Global Renewable Mandates & Corporate RE100 Targets
More than 400 multinational firms have pledged 100% renewable electricity, together consuming upwards of 380 TWh annually, roughly Germany's load. These commitments force large facilities to store surplus midday solar and nighttime wind for evening peaks, converting variable output into dispatchable supply. Google's 300 MW / 30 GWh Minnesota project, operational since mid-2025, cuts fossil peaker reliance by 85% and exemplifies large-scale corporate adoption. In Europe, the REPowerEU plan mandates that 45% of electricity be renewable by 2030, explicitly linking storage targets to congestion relief. Industrial operators in Germany now face curtailment penalties approaching EUR 100 per MWh, making batteries a cost-effective hedge.
High CAPEX vs Diesel Gensets
Installed costs of USD 280-580/kWh still exceed a diesel generator's USD 500-1,000/kW upfront, deterring smaller enterprises lacking low-cost finance, despite superior lifetime economics. Energy-as-a-service contracts help mitigate capital barriers but add transaction complexity.
Other drivers and restraints analyzed in the detailed report include:
- Stand-alone Storage ITC & Equivalent Global Incentives
- Rising Global C&I Peak-Demand Charges
- Critical-Mineral Supply-Chain Volatility
For complete list of drivers and restraints, kindly check the Table Of Contents.
Segment Analysis
Lithium-ion technologies controlled 80.4% of the commercial and industrial energy storage market in 2025, thanks to cycle lives exceeding 6,000 cycles at 80% depth of discharge and lower thermal-runaway risk. Sodium-ion platforms, commercialized by CATL and BYD, are expanding at a 37.5% CAGR through 2031, enabled by abundant raw materials and parity pricing with LFP for stationary duties. Although energy density trails NMC, warehouse rooftops and ground-mount yards offer ample space, softening the penalty for commercial users. Lead-acid remains in telecom backup niches, but environmental disposal rules erode its share each year. Flow batteries, especially vanadium redox and iron-flow variants, are carving out long-duration roles beyond four-hour discharge, with ESS Inc. delivering 500 MWh to industrial microgrids in 2025. Hybrid supercapacitors secure frequency-regulation contracts in markets like PJM, though low energy density caps their addressable segment. Solid-state chemistries linger in pilot stages; wide deployment before 2028 appears unlikely, given unresolved manufacturing scale-up hurdles. Mandatory UL 9540A testing, now common in the United States and Europe, adds USD 30,000-50,000 per project but cuts insurance costs by up to 25%, improving lifecycle economics for compliant suppliers.
Second-life automotive packs, retired at 70-80% state of health, entice value-oriented buyers, offering landed costs 40-50% below new systems. Standardization, however, lags: warranty schemes, cell traceability, and varying chemistries complicate integration. The resulting patchwork slows widespread adoption, but localized pilots in Spain and California illustrate promise for price-sensitive commercial users. On balance, technology diversification widens choice yet reinforces lithium-ion's incumbency, sustaining its leading position in the commercial and industrial energy storage market.
Geography Analysis
North America captured 36.5% of global installations in 2025, with the United States accounting for the lion's share after the standalone-storage Investment Tax Credit removed co-location requirements. California leads, exceeding 3 GW of commercial deployments by the end of 2025 under the Self-Generation Incentive Program that rebates up to USD 200 per kWh. Texas follows as ERCOT's energy-only market swings more than USD 0.20 per kWh during summer peaks, ideal for wholesale arbitrage. Canada's growth centers on Ontario and Alberta, where provincial incentives and microgrid needs intersect. Mexico remains nascent; lower tariffs and scarce financing limit adoption, though pilot projects are underway in Monterrey manufacturing zones. Asia-Pacific is the fastest-growing region, projected at a 23.3% CAGR through 2031. China's vertically integrated giants supply more than half of worldwide commercial shipments, keeping average system costs 20-30% below Western equivalents. India mandates two-hour storage for commercial solar above 500 kW, igniting activity in Gujarat and Maharashtra. Japan and South Korea prioritize resilience against natural disasters and supply-chain shocks, prompting corporate buyers like Toyota to install on-site batteries. ASEAN states advance unevenly, Thailand and Vietnam attract FDI-backed factories that embrace storage, but diesel subsidies in Indonesia slow progress. Australia and New Zealand deploy aggressively because high retail tariffs and prolific rooftop solar heighten self-consumption benefits.
Germany's industrial hubs deploy batteries to dodge curtailment fees when renewables drive spot prices negative more than 200 days each year. The United Kingdom's capacity-market auctions reward multi-hour assets, spurring supermarket chains and parcel depots to contract storage under twelve-year agreements. France, Spain, and Italy scale installations to integrate growing solar pipelines and comply with Fit-for-55 decarbonization targets. The Nordics pair wind with hydropower balancing, yet still adopt batteries for frequency support and grid congestion relief. Russia lags due to low tariffs and limited incentives; deployments are confined to remote mines and oil-and-gas outposts. In South America, the Middle East & Africa, Brazil, the UAE, and South Africa exhibit pilot activity in malls and telecom sites. Regional disparities notwithstanding, every continent now records commercial projects, underscoring the broad geographic spread of the commercial and industrial energy storage market.
- Tesla Inc.
- Fluence Energy
- LG Energy Solution
- BYD Co. Ltd.
- CATL
- Panasonic Holdings Corp.
- Saft (TotalEnergies)
- Samsung SDI
- Sungrow Power Supply
- Powin Energy
- Wartsila
- Eos Energy Enterprises
- ABB
- Schneider Electric
- Eaton
- Enphase Energy
- Hitachi Energy
- Generac Power Systems
- Kokam
- ESS Inc.
- EnerSys
Additional Benefits:
- The market estimate (ME) sheet in Excel format
- 3 months of analyst support
TABLE OF CONTENTS
1 Introduction
- 1.1 Study Assumptions & Market Definition
- 1.2 Scope of the Study
2 Research Methodology
3 Executive Summary
4 Market Landscape
- 4.1 Market Overview
- 4.2 Market Drivers
- 4.2.1 Li-ion cost curve approaching sub-$90/kWh
- 4.2.2 Global renewable mandates & corporate RE100 targets
- 4.2.3 Stand-alone storage ITC (US) & equivalent global incentives
- 4.2.4 Rising global C&I peak-demand charges
- 4.2.5 Hyperscale data-centre grid-deferral demand
- 4.2.6 Surge in synthetic PPAs needing dispatchable load-shifting
- 4.3 Market Restraints
- 4.3.1 High CAPEX vs diesel gensets
- 4.3.2 Critical-mineral supply-chain volatility
- 4.3.3 Fragmented interconnection & permitting rules
- 4.3.4 Urban fire-code compliance costs for indoor BESS
- 4.4 Supply-Chain Analysis
- 4.5 Regulatory Landscape
- 4.6 Technological Outlook
- 4.6.1 Advances in Battery Chemistries
- 4.6.2 Role of AI & IoT in EMS/DERMS
- 4.6.3 Second-life Battery Applications
- 4.6.4 Emerging Hybrid & Long-Duration Systems
- 4.7 Porters Five Forces Analysis
- 4.7.1 Supplier Power
- 4.7.2 Buyer Power
- 4.7.3 Threat of Substitutes
- 4.7.4 Threat of New Entrants
- 4.7.5 Competitive Rivalry
- 4.8 Pricing Analysis
- 4.9 Impact of Macroeconomic & Geopolitical Factors
- 4.9.1 Supply-chain disruptions
- 4.9.2 Tariff & trade-policy shifts
- 4.9.3 Investment & interest-rate trends
5 Market Size & Growth Forecasts
- 5.1 By Technology
- 5.1.1 Lithium-ion (LFP, NMC/NCA, LCO)
- 5.1.2 Sodium-ion
- 5.1.3 Lead-acid (VRLA, Flooded)
- 5.1.4 Flow Batteries (Vanadium-Redox, Zinc-Bromine)
- 5.1.5 Hybrid Super-capacitor Systems
- 5.1.6 Other Emerging Chemistries (Solid-state, Metal-air)
- 5.2 By Application
- 5.2.1 Peak Shaving
- 5.2.2 Load Shifting
- 5.2.3 Backup Power/UPS
- 5.2.4 Renewable Integration
- 5.2.5 Ancillary Services (Frequency Regulation)
- 5.2.6 Demand-charge Management
- 5.2.7 EV Fast-charging Support
- 5.2.8 Microgrid Stabilisation
- 5.3 By End-user
- 5.3.1 Commercial Buildings (Retail, Offices)
- 5.3.2 Industrial Facilities (Manufacturing, Warehousing)
- 5.3.3 Data Centres
- 5.3.4 Educational Institutions
- 5.3.5 Healthcare Facilities
- 5.3.6 Telecom BTS and Edge Sites
- 5.3.7 EV-fleet Operators and Charging Hubs
- 5.3.8 Public Infrastructure (Airports, Rail)
- 5.4 By Geography
- 5.4.1 North America
- 5.4.1.1 United States
- 5.4.1.2 Canada
- 5.4.1.3 Mexico
- 5.4.2 Europe
- 5.4.2.1 United Kingdom
- 5.4.2.2 Germany
- 5.4.2.3 France
- 5.4.2.4 Spain
- 5.4.2.5 Nordic Countries
- 5.4.2.6 Russia
- 5.4.2.7 Rest of Europe
- 5.4.3 Asia-Pacific
- 5.4.3.1 China
- 5.4.3.2 India
- 5.4.3.3 Japan
- 5.4.3.4 South Korea
- 5.4.3.5 ASEAN Countries
- 5.4.3.6 Australia and New Zealand
- 5.4.3.7 Rest of Asia-Pacific
- 5.4.4 South America
- 5.4.4.1 Brazil
- 5.4.4.2 Argentina
- 5.4.4.3 Colombia
- 5.4.4.4 Rest of South America
- 5.4.5 Middle East and Africa
- 5.4.5.1 United Arab Emirates
- 5.4.5.2 Saudi Arabia
- 5.4.5.3 South Africa
- 5.4.5.4 Egypt
- 5.4.5.5 Rest of Middle East and Africa
- 5.4.1 North America
6 Competitive Landscape
- 6.1 Market Concentration
- 6.2 Strategic Moves (M&A, Partnerships, PPAs)
- 6.3 Market Share Analysis (Market Rank/Share for key companies)
- 6.4 Company Profiles (includes Global level Overview, Market level overview, Core Segments, Financials as available, Strategic Information, Products & Services, and Recent Developments)
- 6.4.1 Tesla Inc.
- 6.4.2 Fluence Energy
- 6.4.3 LG Energy Solution
- 6.4.4 BYD Co. Ltd.
- 6.4.5 CATL
- 6.4.6 Panasonic Holdings Corp.
- 6.4.7 Saft (TotalEnergies)
- 6.4.8 Samsung SDI
- 6.4.9 Sungrow Power Supply
- 6.4.10 Powin Energy
- 6.4.11 Wartsila
- 6.4.12 Eos Energy Enterprises
- 6.4.13 ABB
- 6.4.14 Schneider Electric
- 6.4.15 Eaton
- 6.4.16 Enphase Energy
- 6.4.17 Hitachi Energy
- 6.4.18 Generac Power Systems
- 6.4.19 Kokam
- 6.4.20 ESS Inc.
- 6.4.21 EnerSys
7 Market Opportunities & Future Outlook
- 7.1 White-space & unmet-need assessment

