
PUBLISHER: Mordor Intelligence | PRODUCT CODE: 2063253

PUBLISHER: Mordor Intelligence | PRODUCT CODE: 2063253
Underground Gas Storage - Market Share Analysis, Industry Trends & Statistics, Growth Forecasts (2026 - 2031)
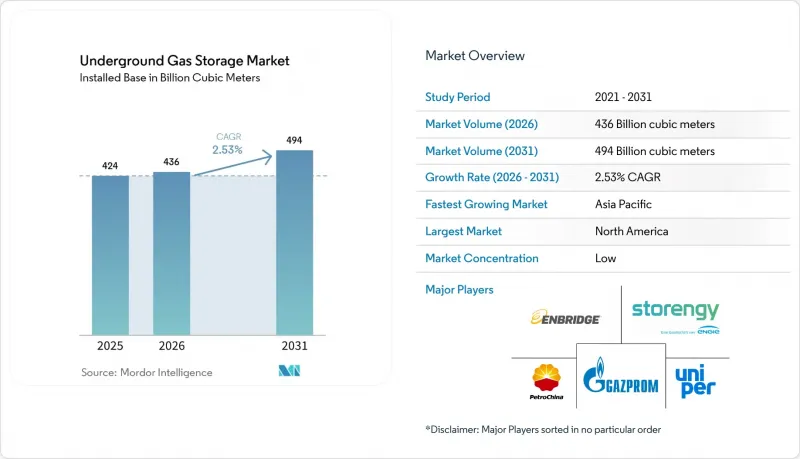
According to Mordor Intelligence, the underground gas storage market size in terms of installed base is projected to expand from 424 billion cubic meters in 2025 and 436 billion cubic meters in 2026 to 494 billion cubic meters by 2031, registering a CAGR of 2.53% between 2026 and 2031.
This report is Segmented by Type (Depleted Reservoirs, Salt Caverns, and More), Storage-Capacity Class (Below 1 Bcf, 1-5 Bcf, and More), Application (Seasonal, Strategic, and More), End-User (Utilities, Industrial, and More), and Geography (North America, Europe, Asia-Pacific, South America, Middle East and Africa). The Market Forecasts are Provided in Terms of Volume (bcm).
Global Underground Gas Storage Market Trends and Insights
Demand for Seasonal & Strategic Working Gas
Seasonal heating cycles and binding storage mandates underpin utilization levels. Germany required 78 TWh of reserves for winter 2024, while the European Union set a 90% fill rule each November, pushing utilities to secure more working gas and injection capacity. India earmarked USD 700 million in its 2025 budget for Phase II strategic gas reserves that will add 3-4 bcm in depleted wells, trimming LNG-import exposure. PetroChina added 6 bcm of working capacity by purchasing former production fields for USD 5.59 billion, stabilizing seasonal swings in northern provinces. Such policy-led expansions create a structural utilization floor, shielding operators from spot-price shocks and supporting long-cycle investment.
Growing Gas-Fired Power Generation & Peak-Shaving Demand
Coal-to-gas switching and renewable intermittency boost the premium on rapid-cycle storage. NERC reports that deliverability above 70 Bcf per day lets North American utilities meet intra-day ramps without over-scheduling turbines . Salt caverns satisfy hourly cycling; Enbridge's Dawn Hub in Ontario is investing USD 400 million to add 1.5 Bcf per day of deliverability for the province's grid as coal plants retire . India plans to triple gas-fired capacity by 2030, requiring aquifer and depleted-field projects in Gujarat and Rajasthan to modulate monsoon-related demand troughs.
High Capital Plus Cushion-Gas Cost Burden
CEDIGAZ pegs the cumulative investment need at EUR 100-170 billion through 2035, with depleted-reservoir conversions costing EUR 190 per MWh and greenfield caverns EUR 235 per MWh . Aquifer projects immobilize 45-80% of capacity in base gas; at 2025 spot prices near USD 3/MMBtu, a 10 Bcf site locks up USD 15-24 million that yields no revenue. India's government budgeted up to USD 2 billion for its strategic program, showing how fiscal pressure can delay timelines.
Other drivers and restraints analyzed in the detailed report include:
- Energy-Security Diversification after Russia-Ukraine Crisis
- Integration of UGS with Low-Carbon Hydrogen Hubs
- Battery Storage & LNG Regasification as Competing Peakers
For complete list of drivers and restraints, kindly check the Table Of Contents.
Segment Analysis
Depleted reservoirs delivered 78.5% of capacity in 2025, reflecting their favorable cushion-gas ratios of 20-40%, yet salt caverns are on a 9.1% CAGR trajectory because they enable hourly cycling and hydrogen storage. The underground gas storage market size for salt caverns is projected to expand faster than aquifers because caverns support deliverability of 1 Bcf per day or more, a crucial attribute for balancing renewable-heavy grids.
Capital efficiency still favors depleted fields for seasonal roles, but regulatory pushes toward hydrogen raise the appeal of caverns. Germany's BMWK foresees 250 caverns converting for 76-80 TWh hydrogen capacity by 2045. Centrica committed GBP 2 billion to ready the 54 Bcf Rough site for hydrogen by 2050, showing incumbents repositioning assets to defend the underground gas storage market share amid decarbonization.
Sites above 20 Bcf controlled 54% of installed capacity in 2025, led by mega-reservoirs such as Rough and Golden Triangle, which offer economies of scale and simplified offtake contracts. Still, 5-20 Bcf facilities will grow 6.8% annually as midstream operators acquire stranded fields near industrial clusters. Williams Companies' USD 1.95 billion purchase of 115 Bcf in Louisiana and Mississippi illustrates this scaling tactic.
Regulation nudges consolidation upward. The EPA methane rule applies to throughput above 50 MMcf per day, adding compliance costs that smaller sites struggle to absorb. Consequently, investors gravitate to larger assets with diversified revenue and lower unit costs, reinforcing a tilt toward the upper capacity tiers of the underground gas storage market.
Geography Analysis
North America held 37.9% of the underground gas storage market share in 2025, underpinned by more than 400 facilities totaling 4.8 Tcf of working capacity. The U.S. added 70 Bcf of demonstrated peak capacity after retrofits aligned with the EPA's 2024 methane rule, while Canada's Dawn Hub expansion targets 1.5 Bcf per day of new deliverability. Private-equity firms such as Sixth Street and Caliche bought Central Valley and Golden Triangle Storage to capture stable, inflation-hedged cash flows.
Energy-security imperatives drive Europe's capacity build. Germany stored 78 TWh by late 2024 under its refill decree, and BMWK foresees 2-7 TWh of hydrogen storage by 2030. The UK reopened Rough and earmarked GBP 2 billion for hydrogen conversion, while Denmark's Lille Torup caverns will tie into a 550 km pipeline to the Netherlands by 2030. Russia remains sizable but opaque as sanctions steer exports eastward.
Asia-Pacific represents the fastest-growing underground gas storage market, expanding 11.5% per year to 2031. China moved to sixth globally after adding 6 bcm of capacity and acquiring 10.97 bcm of working gas for USD 5.9 billion. India's Phase II program funds 3-4 bcm by 2030, and Japan's Osaka Gas invests USD 469 million for quake-proofed pipelines linked to underground storage. South Korea's Yeosu and Ulsan LNG terminals enhance peaking supply without geological barriers, while ASEAN states explore pilots to backstop nascent gas-fired power fleets.
- Gazprom
- PetroChina (CNPC)
- Royal Dutch Shell plc
- TotalEnergies SE
- Chevron Corp.
- Uniper SE
- Enbridge Inc.
- TC Energy Corp.
- NAFTA a.s.
- Eni SpA
- Storengy (ENGIE)
- Centrica Storage
- Kinder Morgan
- RWE Gas Storage
- INEOS Energy Storage
- Linde Engineering (Hydrogen Caverns)
- Enagas S.A.
- Osaka Gas Co.
- Gasunie (Gasunie UGS)
- Energinet DK
Additional Benefits:
- The market estimate (ME) sheet in Excel format
- 3 months of analyst support
TABLE OF CONTENTS
1 Introduction
- 1.1 Study Assumptions & Market Definition
- 1.2 Scope of the Study
2 Research Methodology
3 Executive Summary
4 Market Landscape
- 4.1 Market Overview
- 4.2 Market Drivers
- 4.2.1 Demand for seasonal & strategic working gas
- 4.2.2 Growing gas-fired power generation & peak-shaving demand
- 4.2.3 Energy-security diversification after Russia-Ukraine crisis
- 4.2.4 Integration of UGS with low-carbon hydrogen hubs
- 4.2.5 Digital-twin & AI reservoir optimisation boosts economics
- 4.2.6 Methane-leakage regulations incentivising retrofit projects
- 4.3 Market Restraints
- 4.3.1 High capital plus cushion-gas cost burden
- 4.3.2 Environmental, seismic & brine-disposal risks
- 4.3.3 Battery-storage & LNG regasification as competing peakers
- 4.3.4 Net-zero policy uncertainty for long-lived gas assets
- 4.4 Supply-Chain Analysis
- 4.5 Regulatory Landscape
- 4.6 Technological Outlook
- 4.7 Porter's Five Forces
- 4.7.1 Threat of New Entrants
- 4.7.2 Bargaining Power of Buyers
- 4.7.3 Bargaining Power of Suppliers
- 4.7.4 Threat of Substitutes
- 4.7.5 Competitive Rivalry
5 Market Size & Growth Forecasts
- 5.1 By Type
- 5.1.1 Depleted Gas Reservoirs
- 5.1.2 Salt Caverns
- 5.1.3 Aquifer Reservoirs
- 5.1.4 LNG Re-injection Facilities
- 5.2 By Storage-Capacity Class
- 5.2.1 Below 1 Bcf
- 5.2.2 1 to 5 Bcf
- 5.2.3 5 to 20 Bcf
- 5.2.4 Above 20 Bcf
- 5.3 By Application
- 5.3.1 Seasonal Storage
- 5.3.2 Strategic Reserve
- 5.3.3 Peak Shaving
- 5.3.4 Balancing and Load Management
- 5.4 By End-user
- 5.4.1 Gas and Power Utilities
- 5.4.2 Industrial and Petrochemical
- 5.4.3 Commercial/Residential Distributors
- 5.4.4 Mid-stream Operators
- 5.4.5 Government and Emergency Agencies
- 5.5 By Geography
- 5.5.1 North America
- 5.5.1.1 United States
- 5.5.1.2 Canada
- 5.5.1.3 Mexico
- 5.5.2 Europe
- 5.5.2.1 Germany
- 5.5.2.2 United Kingdom
- 5.5.2.3 France
- 5.5.2.4 Italy
- 5.5.2.5 NORDIC Countries
- 5.5.2.6 Russia
- 5.5.2.7 Rest of Europe
- 5.5.3 Asia-Pacific
- 5.5.3.1 China
- 5.5.3.2 India
- 5.5.3.3 Japan
- 5.5.3.4 South Korea
- 5.5.3.5 ASEAN Countries
- 5.5.3.6 Rest of Asia-Pacific
- 5.5.4 South America
- 5.5.4.1 Brazil
- 5.5.4.2 Argentina
- 5.5.4.3 Rest of South America
- 5.5.5 Middle East and Africa
- 5.5.5.1 Saudi Arabia
- 5.5.5.2 United Arab Emirates
- 5.5.5.3 South Africa
- 5.5.5.4 Egypt
- 5.5.5.5 Rest of Middle East and Africa
- 5.5.1 North America
6 Competitive Landscape
- 6.1 Market Concentration
- 6.2 Strategic Moves (M&A, Partnerships, PPAs)
- 6.3 Market Share Analysis (Market Rank/Share for key companies)
- 6.4 Company Profiles (includes Global level Overview, Market level overview, Core Segments, Financials as available, Strategic Information, Products & Services, and Recent Developments)
- 6.4.1 Gazprom
- 6.4.2 PetroChina (CNPC)
- 6.4.3 Royal Dutch Shell plc
- 6.4.4 TotalEnergies SE
- 6.4.5 Chevron Corp.
- 6.4.6 Uniper SE
- 6.4.7 Enbridge Inc.
- 6.4.8 TC Energy Corp.
- 6.4.9 NAFTA a.s.
- 6.4.10 Eni SpA
- 6.4.11 Storengy (ENGIE)
- 6.4.12 Centrica Storage
- 6.4.13 Kinder Morgan
- 6.4.14 RWE Gas Storage
- 6.4.15 INEOS Energy Storage
- 6.4.16 Linde Engineering (Hydrogen Caverns)
- 6.4.17 Enagas S.A.
- 6.4.18 Osaka Gas Co.
- 6.4.19 Gasunie (Gasunie UGS)
- 6.4.20 Energinet DK
7 Market Opportunities & Future Outlook
- 7.1 Hydrogen-ready cavern conversions
- 7.2 Digitalised smart-storage optimisation
- 7.3 Rising strategic stockpiles in emerging Asia
- 7.4 Modular micro-cavern solutions for LNG-to-gas projects

