
PUBLISHER: Mordor Intelligence | PRODUCT CODE: 2063383

PUBLISHER: Mordor Intelligence | PRODUCT CODE: 2063383
Big Data Analytics In Retail - Market Share Analysis, Industry Trends & Statistics, Growth Forecasts (2026 - 2031)
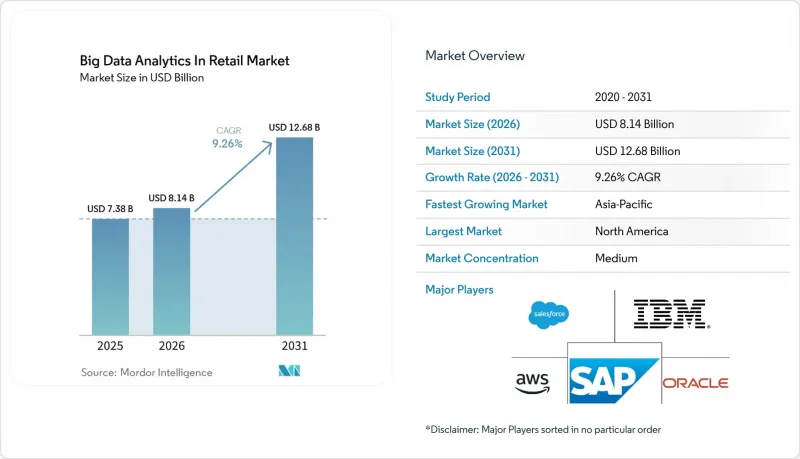
According to Mordor Intelligence, the big data analytics in retail market size is projected to be USD 7.38 billion in 2025, USD 8.14 billion in 2026, and reach USD 12.68 billion by 2031, advancing at a 9.26% CAGR across the period.
This report is Segmented by Application (Merchandising and Supply Chain Analytics, and More), Business Type (Small and Medium Enterprises, and More), Deployment Mode (On-Premise, and Cloud), Analytics Type (Descriptive Analytics, and More), Component (Software, and Services), Retail Format (E-Commerce Stores, and More), and Geography. The Market Forecasts are Provided in Terms of Value (USD).
Global Big Data Analytics In Retail Market Trends and Insights
Surge in Real-Time Omni-Channel Personalisation
Retailers have embedded streaming engines that ingest clickstream, point-of-sale, and mobile-app events within milliseconds, allowing offers and recommendations that mirror a shopper's most recent action. Amazon Web Services spotlighted this capability in its 2025 keynote as critical for reducing cart abandonment during seasonal peaks. Walmart's rollout across 4,700 United States stores combined beacon signals and online histories to boost cross-category basket value by 12%. The approach requires rigorous fairness checks because under-represented cohorts can skew training data, a risk the European Artificial Intelligence Act addresses through transparency mandates.
Integration of Retail Media Networks with First-Party Data
On-site advertising platforms generated USD 50 billion global revenue in 2025, fueled by purchase-based targeting that links impressions to in-basket sales. Kroger grew its advertiser base 38% by activating anonymized loyalty data inside privacy-preserving clean rooms. Snowflake and Google Cloud formalized joint clean-room products in early 2026, enabling cross-dataset joins without exposing raw records.
Fragmentation of Legacy POS and ERP Stacks
A 2025 National Retail Federation survey showed 63% of United States chains operate at least three transaction systems lacking interoperability, delaying unified customer profiles and real-time inventory. Replacement costs often exceed USD 50 million for large chains, crowding out customer-facing investments. Batch extracts inhibit sub-second decisioning, limiting benefits from real-time personalization and price optimization.
Other drivers and restraints analyzed in the detailed report include:
- Expansion of Edge Analytics for In-Store IoT
- Growing Adoption of AI-Powered Price Optimisation Engines
- Privacy-Centric Browser and OS Restrictions
For complete list of drivers and restraints, kindly check the Table Of Contents.
Segment Analysis
Fraud Detection is growing at a 10.76% CAGR through 2031, making it the fastest-moving application within the big data analytics in retail market. Account-takeover and synthetic identity attacks targeting omnichannel payment flows are driving investment in graph-analysis and behavioral biometrics. Customer Analytics still delivered 37.29% of 2025 revenue, but its trajectory is flattening as segmentation and lifetime-value models mature. Merchandising and supply-chain teams now rely on prescriptive engines that automate replenishment based on external factors such as weather and social sentiment.
Operational intelligence dashboards have become commoditized, pressuring vendors to embed vertical add-ons like pharmacy compliance tracking. The big data analytics in retail market size attributed to Fraud Detection is expected to widen as buy-now-pay-later and digital wallets expand the threat surface. Vendors are differentiating through low-false-positive models that preserve frictionless checkout. Retailers also integrate fraud insights into personalization workflows so high-risk profiles trigger additional verification, balancing security with customer experience.
Small and Medium Enterprises are set to expand revenue at 9.61% CAGR, leveraging usage-based cloud platforms that bundle warehousing, machine learning, and visualization. Large Enterprises controlled 63.24% of 2025 spending, anchored by multi-year vendor contracts and larger staffing budgets. AutoML features and pre-built connectors let regional grocers deploy advanced tools without in-house data engineers, democratizing sophisticated analytics capabilities.
Large chains still negotiate deep volume discounts, yet their complex organizations slow company-wide rollouts. The big data analytics in retail market size flowing from SMEs is rising as composable commerce lets them plug in best-of-breed modules instead of overhauling entire stacks. Cloud providers lure these retailers with starter tiers that scale elastically, allowing experimentation without capital risk. Talent shortages remain a constraint, though managed services and guided notebooks mitigate the skills gap.
Geography Analysis
North America supplied 47.62% of 2025 revenue, supported by early adoption of customer data platforms and a dense ecosystem of analytics vendors. The region is now shifting toward incremental optimization, with retailers layering clean rooms and explainable AI atop existing investments. Asia-Pacific is forecast to record the highest 11.01% CAGR, propelled by China's social-commerce giants and India's Unified Payments Interface, which processed 11.6 billion transactions in December 2025, producing granular behavioral data for analytics pipelines.
In China, closed-loop attribution is feasible because Alipay and WeChat integrate payments, social engagement, and loyalty in a single ecosystem, an advantage Western markets struggle to replicate. Japan and South Korea are piloting cashierless stores, boosting demand for edge inference and computer vision. Australia is expanding data-sharing regulations that encourage open banking-style portability for retail transaction data, setting a precedent for other jurisdictions.
Europe faces slower growth owing to stringent data-protection rules, yet it plays a lead role in federated learning trials that train models across decentralized nodes without moving raw data. Middle East luxury retailers and hypermarkets are adopting high-margin personalization engines as tourism rebounds, while Africa's nascent e-commerce relies on lightweight, mobile-first analytics designed for intermittent connectivity. South America's expansion is tempered by macroeconomic volatility and cloud-infrastructure gaps, though Brazil's leading chains are piloting models that adjust for currency swings and import tariffs.
- SAP SE
- International Business Machines Corporation
- Oracle Corporation
- Salesforce, Inc.
- Amazon Web Services, Inc.
- Adobe Inc.
- Microsoft Corporation
- Google LLC
- QlikTech International AB
- Zoho Corporation Pvt. Ltd.
- Alteryx, Inc.
- RetailNext Inc.
- MicroStrategy Incorporated
- Hitachi Vantara LLC
- Fuzzy Logix, Inc.
- Teradata Corporation
- Cloudera, Inc.
- Informatica LLC
- Splunk Inc.
- Databricks, Inc.
- Snowflake Inc.
- SAS Institute Inc.
- dunnhumby Ltd.
Additional Benefits:
- The market estimate (ME) sheet in Excel format
- 3 months of analyst support
TABLE OF CONTENTS
1 INTRODUCTION
- 1.1 Study Assumptions and Market Definition
- 1.2 Scope of the Study
2 RESEARCH METHODOLOGY
3 EXECUTIVE SUMMARY
4 MARKET LANDSCAPE
- 4.1 Market Overview
- 4.2 Market Drivers
- 4.2.1 Surge in Real-Time Omni-Channel Personalisation
- 4.2.2 Rise of Headless Commerce Architectures
- 4.2.3 Integration of Retail Media Networks with First-Party Data
- 4.2.4 Expansion of Edge Analytics for In-Store IoT
- 4.2.5 Growing Adoption of AI-Powered Price Optimisation Engines
- 4.2.6 Mainstreaming of Customer Data Platforms (CDPs) in Retail
- 4.3 Market Restraints
- 4.3.1 Fragmentation of Legacy POS and ERP Stacks
- 4.3.2 Privacy-Centric Browser and OS Restrictions
- 4.3.3 Shortage of Retail Data Science Talent
- 4.3.4 Escalating Cloud Egress and Data Movement Costs
- 4.4 Industry Value / Supply-Chain Analysis
- 4.5 Impact of Macroeconomic Factors on the Market
- 4.6 Regulatory Landscape
- 4.7 Technological Outlook
- 4.8 Porter's Five Forces Analysis
- 4.8.1 Threat of New Entrants
- 4.8.2 Bargaining Power of Buyers
- 4.8.3 Bargaining Power of Suppliers
- 4.8.4 Threat of Substitute Products
- 4.8.5 Intensity of Competitive Rivalry
5 MARKET SIZE AND GROWTH FORECASTS (VALUE)
- 5.1 By Application
- 5.1.1 Merchandising and Supply Chain Analytics
- 5.1.2 Social Media Analytics
- 5.1.3 Customer Analytics
- 5.1.4 Operational Intelligence
- 5.1.5 Pricing Optimisation
- 5.1.6 Fraud Detection
- 5.1.7 Other Applications, Application
- 5.2 By Business Type
- 5.2.1 Small and Medium Enterprises
- 5.2.2 Large Enterprises
- 5.3 By Deployment Mode
- 5.3.1 On-Premise
- 5.3.2 Cloud
- 5.4 By Analytics Type
- 5.4.1 Descriptive Analytics
- 5.4.2 Diagnostic Analytics
- 5.4.3 Predictive Analytics
- 5.4.4 Prescriptive Analytics
- 5.5 By Component
- 5.5.1 Software
- 5.5.2 Services
- 5.6 By Retail Format
- 5.6.1 E-Commerce Stores
- 5.6.2 Brick-and-Mortar Stores
- 5.6.3 Omnichannel Retailers
- 5.6.4 Direct-to-Consumer Brands
- 5.7 By Geography
- 5.7.1 North America
- 5.7.1.1 United States
- 5.7.1.2 Canada
- 5.7.1.3 Mexico
- 5.7.2 Europe
- 5.7.2.1 United Kingdom
- 5.7.2.2 Germany
- 5.7.2.3 France
- 5.7.2.4 Italy
- 5.7.2.5 Rest of Europe
- 5.7.3 Asia-Pacific
- 5.7.3.1 China
- 5.7.3.2 Japan
- 5.7.3.3 India
- 5.7.3.4 South Korea
- 5.7.3.5 Rest of Asia-Pacific
- 5.7.4 Middle East
- 5.7.4.1 Israel
- 5.7.4.2 Saudi Arabia
- 5.7.4.3 United Arab Emirates
- 5.7.4.4 Turkey
- 5.7.4.5 Rest of Middle East
- 5.7.5 Africa
- 5.7.5.1 South Africa
- 5.7.5.2 Egypt
- 5.7.5.3 Rest of Africa
- 5.7.6 South America
- 5.7.6.1 Brazil
- 5.7.6.2 Argentina
- 5.7.6.3 Rest of South America
- 5.7.1 North America
6 COMPETITIVE LANDSCAPE
- 6.1 Market Concentration
- 6.2 Strategic Moves
- 6.3 Market Share Analysis
- 6.4 Company Profiles (includes Global Level Overview, Market Level Overview, Core Segments, Financials as available, Strategic Information, Market Rank/Share, Products and Services, Recent Developments)
- 6.4.1 SAP SE
- 6.4.2 International Business Machines Corporation
- 6.4.3 Oracle Corporation
- 6.4.4 Salesforce, Inc.
- 6.4.5 Amazon Web Services, Inc.
- 6.4.6 Adobe Inc.
- 6.4.7 Microsoft Corporation
- 6.4.8 Google LLC
- 6.4.9 QlikTech International AB
- 6.4.10 Zoho Corporation Pvt. Ltd.
- 6.4.11 Alteryx, Inc.
- 6.4.12 RetailNext Inc.
- 6.4.13 MicroStrategy Incorporated
- 6.4.14 Hitachi Vantara LLC
- 6.4.15 Fuzzy Logix, Inc.
- 6.4.16 Teradata Corporation
- 6.4.17 Cloudera, Inc.
- 6.4.18 Informatica LLC
- 6.4.19 Splunk Inc.
- 6.4.20 Databricks, Inc.
- 6.4.21 Snowflake Inc.
- 6.4.22 SAS Institute Inc.
- 6.4.23 dunnhumby Ltd.
7 MARKET OPPORTUNITIES AND FUTURE OUTLOOK
- 7.1 White-Space and Unmet-Need Assessment

