
PUBLISHER: Mordor Intelligence | PRODUCT CODE: 2063421

PUBLISHER: Mordor Intelligence | PRODUCT CODE: 2063421
Enterprise AI Workforce Platforms - Market Share Analysis, Industry Trends & Statistics, Growth Forecasts (2026 - 2031)
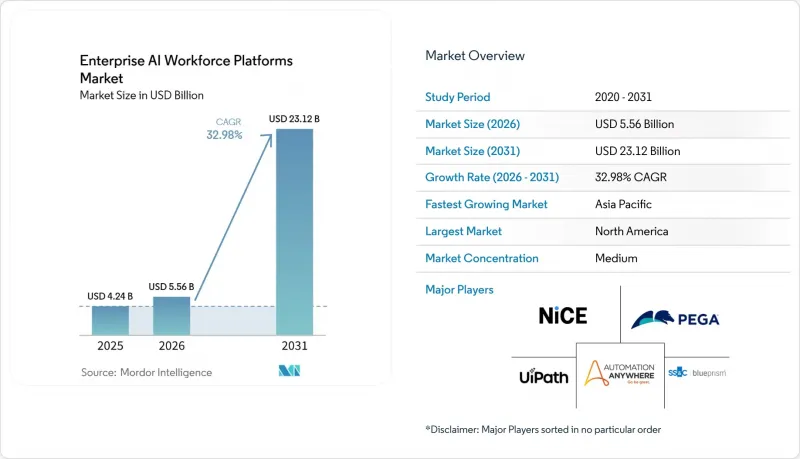
According to Mordor Intelligence, the enterprise AI workforce platforms market size is projected to be USD 4.24 billion in 2025, USD 5.56 billion in 2026, and reach USD 23.12 billion by 2031, growing at a CAGR of 32.98% from 2026 to 2031.
This report is Segmented by Deployment Mode (On-Premise, Cloud, and Hybrid), Component (Software and Services), End-User Industry (IT and Telecom, Healthcare and Life Sciences, Manufacturing, BFSI, Retail and E-Commerce, Education, and More), Organization Size (Large Enterprises and Small and Medium Enterprises), and Geography. The Market Forecasts are Provided in Terms of Value (USD).
Global Enterprise AI Workforce Platforms Market Trends and Insights
Integration of Generative AI Co-Pilots into Enterprise Productivity Suites
Embedding co-pilots inside familiar collaboration tools removes the hand-off between task identification and automation, allowing workers to invoke agents without leaving the application of record. Microsoft reported 1 million paying Copilot subscribers by January 2025 and indicated 29% time savings on document creation and meeting summarization tasks. Salesforce followed up with Agentforce, enabling non-technical staff to launch autonomous customer service agents that shortened resolution time by 40% in pilots. Tight integration raises switching costs because enterprises prefer bundled upgrades over separate procurement cycles. Compliance frameworks such as ISO/IEC 42001 are pushing vendors to certify embedded co-pilots, further cementing incumbent productivity-suite providers on buyer shortlists. Collectively, these dynamics front-load demand and support premium pricing during the first wave of adoption.
Rising Labor Cost Inflation Accelerating Automation ROI
Annual wage growth of 8-10% in India's IT services sector and 7-9% in the Philippines' call-center workforce during 2025 shrank the economic spread between human labor and autonomous agents. Breakeven periods for invoice-processing automation contracts are projected to decrease from 24 months in 2023 to 14 months in 2025. Vietnam's government reacted by creating a USD 200 million incentive fund for industrial AI deployments, signifying policy alignment with enterprise automation goals. As a result, CFOs now frame AI workforce investments as inflation hedges that stabilize operating margins. The fiscal logic reinforces multi-year budget allocations, especially within back-office functions where repetitive workflows dominate cost structures.
Persistent Data Residency and Sovereignty Concerns Limiting Cross-Border Deployments
The EU General Data Protection Regulation, China's Cybersecurity Law, and India's Digital Personal Data Protection Act prohibit unrestricted data transfer, compelling enterprises to adopt hybrid topologies with sovereign partitions. Compliance overhead elevates the total cost of ownership by requiring redundant stacks, contractual safeguards, and localized support teams. An International Association of Privacy Professionals survey found that 58% of multinationals postponed AI workforce deployments due to lingering uncertainty over legal transfer mechanisms. Vendors have responded with regionalized control planes and edge options, but premium pricing and maintenance complexity neutralize some of the cost savings that cloud models promise. The fragmentation risk is greatest in sectors that hold sensitive data, such as healthcare, banking, and public administration.
Other drivers and restraints analyzed in the detailed report include:
- Rapid Adoption of Low-Code and No-Code AI Orchestration Platforms for Citizen Developers
- Availability of Pre-Built AI Workforce Skill Libraries from Independent ISVs
- Shortage of Domain-Specific AI Training Data for Non-English Knowledge Work
For complete list of drivers and restraints, kindly check the Table Of Contents.
Segment Analysis
Intelligent automation suites held 41.37% of 2025 revenue, confirming their role as the first step on most transformation roadmaps. Enterprises value the suites' integrated process mining and document intelligence modules, which surface high-ROI use cases and supply training data to models that handle exceptions. Vendors are folding conversational AI work assistants into the same stack, enabling the enterprise AI workforce platforms market size for agentic chatbots to climb rapidly in customer-facing scenarios. Skill development platforms, however, register the steepest climb at a 33.98% CAGR, reflecting a strategic pivot toward reskilling workers displaced by automation. Coursera logged a 180% enrollment jump in generative AI courses during 2025. That surge signals institutional commitment to internal talent marketplaces that match verified competencies with project needs across business lines.
Workforce analytics platforms now fuse predictive modeling with real-time productivity telemetry, encouraging proactive interventions before attrition or performance dips occur. Integrated talent marketplaces blend these insights with gig-style assignments, reducing idle time and improving internal mobility. Microsoft Viva's crossover success, 40 million monthly active users by late 2025, shows that employers want a unified pane of glass for learning, engagement, and analytics. Cross-suite convergence is intensifying competition,because buyers prefer end-to-end provisioning over stitching together point solutions. As convergence advances, the enterprise AI workforce platforms market share for standalone point products is likely to compress.
Cloud remained dominant at 63.52% in 2025 thanks to elastic consumption billing and rapid onboarding. Yet stricter localization laws and real-time inference needs are pushing organizations toward hybrid solutions, which are registering a 33.38% CAGR. Financial institutions now keep sensitive workloads on-premise while leveraging public clouds for analytics that fall outside supervisory scope. The EU AI Act's high-risk classification is catalyzing European buyers to enact similar split architectures, forcing vendors to offer compliance toolkits that span edge and cloud.
Manufacturers and hospitals are adopting edge servers for latency-critical inspection and diagnostic tasks, forwarding anonymized data to cloud clusters for retraining. A significant portion of AI workforce adopters prefer a hybrid approach to balance cost, compliance, and performance. Infrastructure vendors such as Dell Technologies and HPE are bundling AI-optimized hardware with orchestration software, opening a parallel revenue stream adjacent to hyperscaler services. Vendors that supply single-pane policy management across deployment types stand to gain incremental stickiness as enterprises avoid siloed admin consoles.
Geography Analysis
North America accounted for 35.73% of global revenue in 2025, maintaining its position as a leading region in the market. This dominance is attributed to several factors, including high wages that drive demand for automation, a well-established, mature cloud ecosystem, and the rapid adoption of productivity-suite co-pilots. These co-pilots enhance operational efficiency and streamline workflows, making them highly sought after by enterprises in the region. Additionally, North America benefits from a robust venture capital ecosystem that actively supports the development and supply of specialized orchestration add-ons. These add-ons further enhance platform functionality and utilization rates, solidifying the region's leadership in the market.
Asia-Pacific is the fastest-growing region, with a 33.98% CAGR projected for 2026-2031. Wage inflation in traditional outsourcing centers is shrinking the labor arbitrage cushion, prompting companies in India, the Philippines, and Vietnam to automate back-office tasks. Government programs reinforce demand. India's National Strategy for Artificial Intelligence earmarked USD 1.2 billion for sectoral AI adoption incentives, while Japan's subsidy program reimburses up to 50% of platform costs for small manufacturers. In China, local vendors integrate AI workforce tools into domestic collaboration suites, sidestepping foreign cloud restrictions.
Europe faces a more nuanced path. The EU AI Act imposes conformity assessments, documentation, and post-market monitoring for high-risk deployments, adding six-to-twelve-month lead times and inflating compliance budgets. Still, public funding for trustworthy AI research ensures that enterprises view automation as inevitable, not optional. South America's growth is concentrated in Brazil and Argentina, where currency volatility motivates CFOs to hedge with productivity gains. Middle East buyers, led by Saudi Arabia and the United Arab Emirates, embed AI agents in e-government services to raise service delivery standards. Africa remains nascent, although South Africa and Kenya display early momentum through partnerships with regional system integrators.
- UiPath Inc.
- Automation Anywhere, Inc.
- SS&C Blue Prism Group Ltd.
- WorkFusion, Inc.
- NICE Ltd.
- Pegasystems Inc.
- Kofax Inc.
- Appian Corporation
- AntWorks Pte Ltd.
- EdgeVerve Systems Limited
- IPsoft Inc. (d/b/a Amelia)
- Laiye Technology Ltd.
- Nintex Global Ltd.
- Cognigy GmbH
- Kore.ai, Inc.
- Aisera, Inc.
- Hyperscience Inc.
- Celonis SE
- Capacity LLC
- Soroco India Private Limited
Additional Benefits:
- The market estimate (ME) sheet in Excel format
- 3 months of analyst support
TABLE OF CONTENTS
1 INTRODUCTION
- 1.1 Study Assumptions and Market Definition
- 1.2 Scope of the Study
2 RESEARCH METHODOLOGY
3 EXECUTIVE SUMMARY
4 MARKET LANDSCAPE
- 4.1 Market Overview
- 4.2 Market Drivers
- 4.2.1 Integration of Generative AI Co-Pilots into Enterprise Productivity Suites
- 4.2.2 Rising Labor Cost Inflation Accelerating Automation ROI
- 4.2.3 Rapid Adoption of Low-Code and No-Code AI Orchestration Platforms for Citizen Developers
- 4.2.4 Availability of Pre-Built AI Workforce Skill Libraries from Independent ISVs
- 4.2.5 Vendor Transition to Consumption-Based Pricing Aligning with Business Outcomes
- 4.2.6 Emergence of AI Governance Tooling Enabling Large-Scale Workforce Deployment
- 4.3 Market Restraints
- 4.3.1 Persistent Data Residency and Sovereignty Concerns Limiting Cross-Border Deployments
- 4.3.2 Shortage of Domain-Specific AI Training Data for Non-English Knowledge Work
- 4.3.3 Employee Resistance due to Job Displacement Anxiety and Union Pushback
- 4.3.4 High Energy and Carbon Footprint of Inference Workloads Curtailing ESG Ambitions
- 4.4 Impact of Macroeconomic Factors on the Market
- 4.5 Industry Value Chain Analysis
- 4.6 Regulatory Landscape
- 4.7 Technological Outlook
- 4.8 Porter's Five Forces Analysis
- 4.8.1 Bargaining Power of Suppliers
- 4.8.2 Bargaining Power of Buyers
- 4.8.3 Threat of New Entrants
- 4.8.4 Threat of Substitutes
- 4.8.5 Intensity of Competitive Rivalry
5 MARKET SIZE AND GROWTH FORECASTS (VALUE)
- 5.1 By Platform
- 5.1.1 Intelligent Automation Suites
- 5.1.2 Conversational AI Work Assistants
- 5.1.3 AI-Driven Skill Development Platforms
- 5.1.4 Workforce Analytics and Optimization Platforms
- 5.1.5 Integrated Talent Marketplace Platforms
- 5.2 By Deployment Model
- 5.2.1 Cloud
- 5.2.2 On-Premise
- 5.2.3 Hybrid
- 5.3 By Organization Size
- 5.3.1 Large Enterprises
- 5.3.2 Small and Medium Enterprises
- 5.4 By End-User Industry
- 5.4.1 IT and Telecom
- 5.4.2 BFSI
- 5.4.3 Healthcare and Life Sciences
- 5.4.4 Retail and E-Commerce
- 5.4.5 Manufacturing
- 5.4.6 Public Sector
- 5.4.7 Other End-User Industries
- 5.5 By Geography
- 5.5.1 North America
- 5.5.1.1 United States
- 5.5.1.2 Canada
- 5.5.1.3 Mexico
- 5.5.2 South America
- 5.5.2.1 Brazil
- 5.5.2.2 Argentina
- 5.5.2.3 Rest of South America
- 5.5.3 Europe
- 5.5.3.1 United Kingdom
- 5.5.3.2 Germany
- 5.5.3.3 France
- 5.5.3.4 Italy
- 5.5.3.5 Spain
- 5.5.3.6 Rest of Europe
- 5.5.4 Asia-Pacific
- 5.5.4.1 China
- 5.5.4.2 Japan
- 5.5.4.3 India
- 5.5.4.4 South Korea
- 5.5.4.5 Rest of Asia-Pacific
- 5.5.5 Middle East and Africa
- 5.5.5.1 Middle East
- 5.5.5.1.1 United Arab Emirates
- 5.5.5.1.2 Saudi Arabia
- 5.5.5.1.3 Rest of Middle East
- 5.5.5.2 Africa
- 5.5.5.2.1 South Africa
- 5.5.5.2.2 Egypt
- 5.5.5.2.3 Rest of Africa
- 5.5.5.1 Middle East
- 5.5.1 North America
6 COMPETITIVE LANDSCAPE
- 6.1 Market Concentration
- 6.2 Strategic Moves
- 6.3 Market Share Analysis
- 6.4 Company Profiles (includes Global Level Overview, Market Level Overview, Core Segments, Financials as available, Strategic Information, Market Rank/Share, Products and Services, Recent Developments)
- 6.4.1 UiPath Inc.
- 6.4.2 Automation Anywhere, Inc.
- 6.4.3 SS&C Blue Prism Group Ltd.
- 6.4.4 WorkFusion, Inc.
- 6.4.5 NICE Ltd.
- 6.4.6 Pegasystems Inc.
- 6.4.7 Kofax Inc.
- 6.4.8 Appian Corporation
- 6.4.9 AntWorks Pte Ltd.
- 6.4.10 EdgeVerve Systems Limited
- 6.4.11 IPsoft Inc. (d/b/a Amelia)
- 6.4.12 Laiye Technology Ltd.
- 6.4.13 Nintex Global Ltd.
- 6.4.14 Cognigy GmbH
- 6.4.15 Kore.ai, Inc.
- 6.4.16 Aisera, Inc.
- 6.4.17 Hyperscience Inc.
- 6.4.18 Celonis SE
- 6.4.19 Capacity LLC
- 6.4.20 Soroco India Private Limited
7 MARKET OPPORTUNITIES AND FUTURE OUTLOOK
- 7.1 White-Space and Unmet-Need Assessment

