
PUBLISHER: Mordor Intelligence | PRODUCT CODE: 2063466

PUBLISHER: Mordor Intelligence | PRODUCT CODE: 2063466
Pharmaceutical CDMO 2.0 - Market Share Analysis, Industry Trends & Statistics, Growth Forecasts (2026 - 2031)
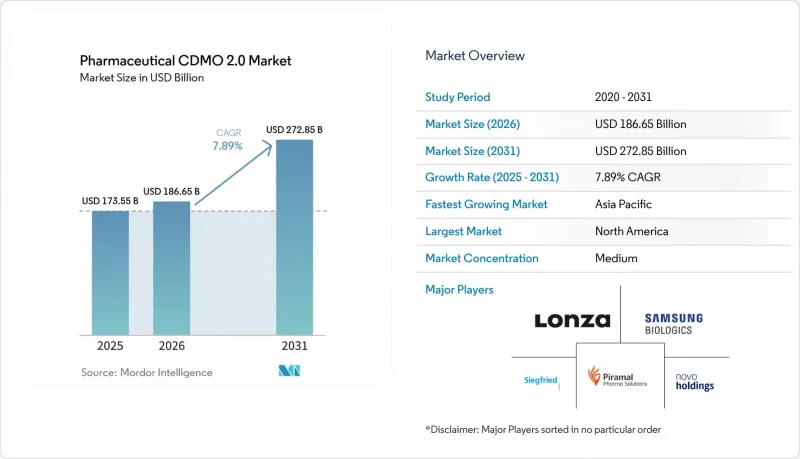
According to Mordor Intelligence, the pharmaceutical cDMO 2.0 market size is expected to grow from USD 173.55 billion in 2025 to USD 186.65 billion in 2026 and is forecast to reach USD 272.85 billion by 2031 at 7.89% CAGR over 2026-2031.
This report is Segmented by Service (API Development & Manufacturing, Finished-Dosage, and More), Molecule Type (Small Molecule, Biologics, and More), Development Phase (Pre-Clinical, Phase I-III, and More), End User (Large Pharma, Emerging / Venture-Backed Biotech and More), and Geography (North America, Europe, Asia-Pacific, and More). Market Forecasts are in Value (USD).
Global Pharmaceutical CDMO 2.0 Market Trends and Insights
Outsourcing Volume Growth Among Large Pharmaceutical Companies
Big pharma is increasing R&D budgets and selectively offloading non-core or early-phase work to partners that provide consultative chemistry, manufacturing, and controls expertise. Sponsors that accept milestone-based fee models and co-investment structures lock in multi-year capacity, giving CDMOs predictable cash flow even as internal manufacturing footprints expand. The approach shields innovators from fixed-asset risk yet keeps critical late-stage or high-volume products in-house. Therefore, demand remains firm for mid-scale capacity that can flex with clinical attrition. CDMOs unable to support collaborative models face margin pressure as buyers consolidate vendor lists to improve oversight. Continued upticks in R&D intensity suggest the volume of externalized projects will keep pace with overall pipeline growth through the medium term.
Surge in Biologics and Complex-Molecule Pipelines
Antibody-drug conjugates, therapeutic peptides, and next-generation modalities dominate new clinical entries. Samsung Biologics commissioned Plant 5 in 2025, raising installed capacity to 784,000 liters, and is already evaluating a sixth plant in anticipation of sustained demand. The FDA issued Chemistry, Manufacturing, and Controls flexibilities for cell and gene therapies in January 2025, shortening dossier preparation and accelerating CDMO onboarding. Technical hurdles such as site-specific conjugation and ultra-low occupational exposure limits for payloads reduce the viable supplier pool, enabling premium pricing. Backlogs in high-titer lentiviral vectors and mRNA push sponsors to reserve suites years ahead of launch. As clinical failure rates winnow projects, CDMOs that can redeploy assets rapidly will mitigate utilization drag.
Stringent Multi-Region Regulatory Requirements
The FDA Quality Management System Regulation takes effect in February 2026 and obliges combination-product manufacturers to align documentation with ISO 13485.The European Medicines Agency tightened Annex 1 contamination-control rules in 2024, forcing upgrades that can cost EUR 5 million to EUR 15 million per site. Japan's PMDA added expanded stability-testing demands in 2025, elongating approval timelines and adding analytical cost. Maintaining parallel systems across authorities stresses mid-tier CDMOs, while larger groups spread compliance overhead across bigger revenue bases. Sponsors favor partners that already hold multi-region licenses, which exacerbates consolidation trends.
Other drivers and restraints analyzed in the detailed report include:
- Cost and Speed Edge in Emerging Markets
- Consolidation Toward End-to-End CDMOs
- Capacity-Utilization and Lead-Time Risk
For complete list of drivers and restraints, kindly check the Table Of Contents.
Segment Analysis
Finished-dosage development and manufacturing is projected to record the quickest 9.01% CAGR as sponsors jostle for pre-filled syringe and vial capacity. Sterile lead times already run 12-24 months, channeling premium pricing to providers that can expand quickly. API development, which commanded 61.09% of the pharmaceutical CDMO 2.0 market share in 2025, remains the volume anchor. Yet margins face pressure as more drug owners dual-source to manage geopolitical and supply chain risks. Analytical and testing tasks grow as regulatory agencies demand greater stability and release packages. At the same time, packaging and logistics units benefit from tailwinds from serialization mandates under the United States Drug Supply Chain Security Act. Smaller biotech companies lacking internal CMC teams depend on CDMOs for formulation and IND-enabling studies, deepening service stickiness.
The influence of capacity shortages has increased innovators' willingness to sign multi-year take-or-pay deals that guarantee access to isolators and automated visual inspection platforms. CDMOs that bundle fill-finish, secondary packaging, and cold-chain logistics present a one-stop pathway that shortens commercialization by several months. As a result, the pharmaceutical CDMO 2.0 market generates higher blended revenue per batch than in the pre-COVID era, offsetting inflation in labor and energy.
Small-molecule programs accounted for 65.21% of the pharmaceutical CDMO 2.0 market in 2025, reflecting the enduring dominance of orally dosed assets. Growth momentum, however, shifts to highly potent APIs, forecast to post an 8.12% CAGR on the back of antibody-drug conjugate payloads and metabolic peptides. Occupational exposure requirements below 10 ng/m3 restrict supply to a compact set of plants with advanced containment suites, giving those providers pricing power. Special analytics, such as drug-to-antibody ratio testing, further differentiate suppliers and add service revenue.
Large-molecule output benefits from Samsung Biologics' collective 784,000-liter footprint and from AGC Biologics' 5,000-liter single-use reactors scheduled to come online in 2027. Cell and gene therapy creates bifurcation: entry-level viral-vector capacity is oversupplied while late-stage, high-titer production remains scarce. CDMOs that can flex suites between mammalian expression, mRNA, and viral platforms enjoy superior utilization and cross-sell opportunities.
Geography Analysis
North America accounted for 40.25% of revenue in 2025, driven by the BIOSECURE Act, which steers contracts toward local and allied facilities. FUJIFILM is building a USD 3.2 billion biologics and mRNA campus in Holly Springs, North Carolina, that will come online in 2028. Resilience added USD 225 million of peptide capacity at its Ohio site to ease GLP-1 shortages. Thermo Fisher's Patheon unit is promoting digital batch recording and predictive maintenance as competitive levers, reflecting a shift in buyer preference toward data-rich manufacturing partners. Mexico is capturing nearshoring interest for secondary packaging and regional distribution, thanks to simplified logistics and low tariffs.
Europe consolidated aggressively during 2025. Blue Wolf combined Synerlab and former Recipharm facilities into Meribel Pharma Solutions, generating a 13-site network with strengths in lyophilization and preservative-free technologies. Almac opened a 100,000-square-foot potent oral-dose plant in Northern Ireland to absorb oncology demand. Germany's Aenova increased its blister and effervescent capacity, confirming a stable appetite for traditional dosage forms even as biologics scale up. The update to Annex 1 raised capital outlays across the region and standardized contamination-control expectations, simplifying multi-country tech transfers.
Asia-Pacific is on the fastest 9.78% CAGR track through 2031. Samsung Biologics' record KRW 2.1 trillion contract in 2024 focused on capacity expansion in South Korea, while Indian CDMOs saw double-digit top-line growth as Western customers diversified their supply chains. AGC Biologics is enhancing its Yokohama site with single-use reactors, bringing advanced mammalian capabilities to Japan. Singapore and Malaysia pitch stable policies and tax incentives, though land costs and the availability of skilled labor temper the pace of build-outs. China remains vital to domestic demand, yet U.S. policy risk pushes multinational sponsors to adopt a "China-plus-one" strategy that reallocates part of the portfolio elsewhere.
South America's market focuses on Brazil, where the national regulator, ANVISA, harmonized with ICH guidelines in 2024, shortening pathways for foreign CDMOs. Currency instability in Argentina complicates capex plans, but a skilled workforce and legacy API infrastructure offer cost-sensitive advantages. Regional governments promote local fill-finish to reduce import dependence, though limited cold-chain networks constrain the distribution of biologics.
- Aenova Group
- AGC Biologics
- Almac
- Asymchem Inc.
- Boehringer Ingelheim
- Cambrex
- Curia Global, Inc.
- FUJIFILM Biotechnologies.
- Lonza Group
- Novo Holdings A/S (Catalent Inc.)
- Piramal Group
- Recipharm AB (EQT AB)
- Rentschler Biopharma
- Samsung Group
- Siegfried Holding AG
- Sterling Pharma Solutions
- Thermo Fisher Scientific Inc. (Patheon)
- Vetter Pharma
- Wuxi Biologics
- Sterling Pharma Solutions
Additional Benefits:
- The market estimate (ME) sheet in Excel format
- 3 months of analyst support
TABLE OF CONTENTS
1 Introduction
- 1.1 Study Assumptions & Market Definition
- 1.2 Scope of the Study
2 Research Methodology
3 Executive Summary
4 Market Landscape
- 4.1 Market Overview
- 4.2 Market Drivers
- 4.2.1 Increasing Outsourcing Volume by Large Pharmaceutical Companies
- 4.2.2 Surge in Biologics and Complex-Molecule Pipelines
- 4.2.3 Cost- and Speed-Advantage of Manufacturing in Emerging Markets
- 4.2.4 Consolidation Toward End-to-End One-Stop CDMOs
- 4.2.5 AI-Enabled Rapid Process-Development Platforms
- 4.2.6 GLP-1 and Peptide HPAPI Capacity Build-Outs
- 4.3 Market Restraints
- 4.3.1 Stringent Multi-Region Regulatory Requirements
- 4.3.2 Capacity-Utilization and Lead-Time Risk
- 4.3.3 High Capex for Sterile Biologics Suites
- 4.3.4 Scarcity of Skilled Aseptic-Manufacturing Talent
- 4.4 Value / Supply-Chain Analysis
- 4.5 Regulatory Landscape
- 4.6 Technological Outlook
- 4.7 Porter's Five Forces Analysis
- 4.7.1 Threat of New Entrants
- 4.7.2 Bargaining Power of Suppliers
- 4.7.3 Bargaining Power of Buyers
- 4.7.4 Threat of Substitutes
- 4.7.5 Competitive Rivalry
5 Market Size & Growth Forecasts
- 5.1 By Service
- 5.1.1 API Development & Manufacturing
- 5.1.2 Finished-Dosage Development & Manufacturing
- 5.1.3 Analytical & Testing Services
- 5.1.4 Packaging & Logistics
- 5.1.5 Other Services
- 5.2 By Molecule Type
- 5.2.1 Small Molecule
- 5.2.2 Large Molecule / Biologics
- 5.2.3 Highly-Potent APIs
- 5.3 By Development Phase
- 5.3.1 Pre-clinical
- 5.3.2 Phase I
- 5.3.3 Phase II
- 5.3.4 Phase III
- 5.3.5 Commercial
- 5.4 By End User
- 5.4.1 Large Pharma
- 5.4.2 Emerging / Venture-backed Biotech
- 5.4.3 Generics / Specialty Pharma
- 5.4.4 Virtual Pharma & Tech-bio
- 5.5 By Geography
- 5.5.1 North America
- 5.5.1.1 United States
- 5.5.1.2 Canada
- 5.5.1.3 Mexico
- 5.5.2 Europe
- 5.5.2.1 United Kingdom
- 5.5.2.2 Germany
- 5.5.2.3 France
- 5.5.2.4 Italy
- 5.5.2.5 Spain
- 5.5.2.6 Rest of Europe
- 5.5.3 Asia-Pacific
- 5.5.3.1 China
- 5.5.3.2 India
- 5.5.3.3 Japan
- 5.5.3.4 South Korea
- 5.5.3.5 Australia
- 5.5.3.6 Rest of Asia-Pacific
- 5.5.4 Middle East and Africa
- 5.5.4.1 GCC
- 5.5.4.2 South Africa
- 5.5.4.3 Rest of Middle East and Africa
- 5.5.5 South America
- 5.5.5.1 Brazil
- 5.5.5.2 Argentina
- 5.5.5.3 Rest of South America
- 5.5.1 North America
6 Competitive Landscape
- 6.1 Market Concentration
- 6.2 Market Share Analysis
- 6.3 Company Profiles (includes Global level Overview, Market level Overview, Core Segments, Financials as available, Strategic Information, Market Rank/Share for key companies, Products & Services, and Recent Developments)
- 6.3.1 Aenova Group
- 6.3.2 AGC Biologics
- 6.3.3 Almac
- 6.3.4 Asymchem Inc.
- 6.3.5 Boehringer Ingelheim International GmbH.
- 6.3.6 Cambrex Corporation
- 6.3.7 Curia Global, Inc.
- 6.3.8 FUJIFILM Biotechnologies.
- 6.3.9 Lonza Group AG
- 6.3.10 Novo Holdings A/S (Catalent Inc.)
- 6.3.11 Piramal Pharma Solutions
- 6.3.12 Recipharm AB (EQT AB)
- 6.3.13 Rentschler Biopharma
- 6.3.14 Samsung Biologics
- 6.3.15 Siegfried Holding AG
- 6.3.16 Sterling Pharma Solutions
- 6.3.17 Thermo Fisher Scientific Inc. (Patheon)
- 6.3.18 Vetter Pharma
- 6.3.19 WuXi Biologics
- 6.3.20 Sterling Pharma Solutions
7 Market Opportunities & Future Outlook
- 7.1 White-space & Unmet-Need Assessment

