
PUBLISHER: Mordor Intelligence | PRODUCT CODE: 2063524

PUBLISHER: Mordor Intelligence | PRODUCT CODE: 2063524
HDAC Inhibitors - Market Share Analysis, Industry Trends & Statistics, Growth Forecasts (2026 - 2031)
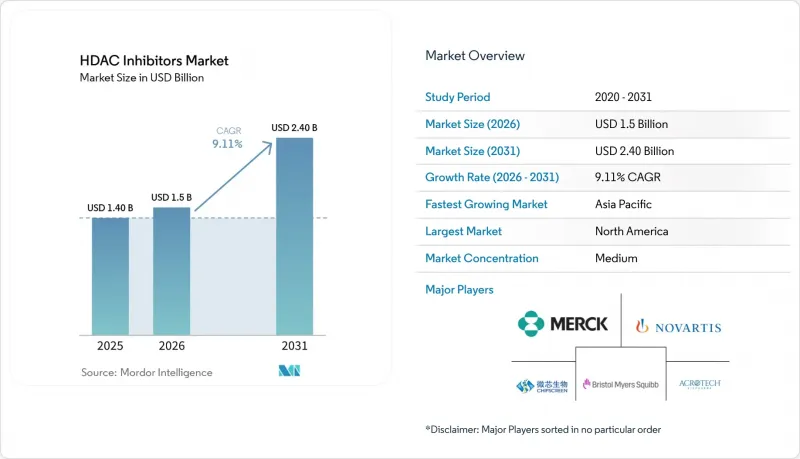
According to Mordor Intelligence, the hDAC inhibitors market size is projected to expand from USD 1.40 billion in 2025 and USD 1.5 billion in 2026 to USD 2.40 billion by 2031, registering a CAGR of 9.11% between 2026 to 2031.
This report is Segmented by Drug Class (Hydroxamic Acid Derivatives, Cyclic Peptides, Benzamides, and More), Application (Oncology, Neurology, Others), Route of Administration (Oral, Intravenous, Topical), Distribution Channel (Hospital Pharmacies, and More), and Geography (North America, Europe, Asia-Pacific, Middle East & Africa, South America). The Market Forecasts are Provided in Terms of Value (USD).
Global HDAC Inhibitors Market Trends and Insights
Expanding Oncology Indications and Orphan Approvals
Orphan designations grant 7 years of exclusivity and waive multi-million-dollar fees, tilting the HDAC inhibitor market toward rare cancers. Cereno won orphan status for CS1 in pulmonary arterial hypertension, and China cleared tucidinostat for biomarker-defined diffuse large B-cell lymphoma, illustrating regulators' appetite for precision labels . Givinostat's mutation-agnostic nod in Duchenne muscular dystrophy shows that broad eligibility can coexist with orphan pricing, though payers are beginning to compare costs against low-priced corticosteroids.
Shift Toward Oral HDAC Inhibitors for Greater Convenience and Adherence
Oral products accounted for 65.91% of 2025 volume, yet hospitals still favor infusions when drugs pair with cytotoxics that require synchronized monitoring. Tucidinostat's 17-hour half-life supports once-daily tablets, while ivaltinostat demonstrated acceptable exposure despite 10.6% oral bioavailability, proving that formulation workarounds can offset low permeability. Reimbursement barriers persist because specialty pharmacies enforce REMS protocols, effectively transforming "oral" convenience into monitored therapy.
Class Toxicity and Narrow Therapeutic Window Limit Dosing
QT prolongation emerges from altered ion-channel trafficking rather than direct hERG block, creating delayed arrhythmia risk that complicates ECG scheduling. WHO VigiAccess lists seven torsades reports for vorinostat, none for romidepsin, underscoring scaffold variability. Givinostat requires weekly platelets during the first month of therapy, reflecting thrombocytopenia tied to HDAC1/2 inhibition.
Other drivers and restraints analyzed in the detailed report include:
- Combination Regimens with Immune Checkpoint Inhibitors and Proteasome Inhibitors
- Expanding Clinical Pipeline and Trial Footprint
- Modest Monotherapy Efficacy in Solid Tumors Slows Uptake
For complete list of drivers and restraints, kindly check the Table Of Contents.
Segment Analysis
Hydroxamic acids held a 62.50% share of the HDAC inhibitor market in 2025 and is expected to grow with 9.50% CAGR by 2031, supported by the legacy use of vorinostat, belinostat, and panobinostat. Despite the risk of thrombocytopenia, oncologists value their multi-isoform potency. Cyclic peptides like romidepsin show lower QT liability, but their smaller label portfolio limits volume. Benzamides, led by tucidinostat, gain regional traction after China's 2024 green-light for diffuse large B-cell lymphoma.
HDAC6-selective pipelines receive venture funding, yet ricolinostat's stalled neuropathy program and KA2507's pending Phase II plans temper expectations. Non-hydroxamate zinc binders are attracting partnerships, highlighted by Celgene's 2026 Acetylon deal, which anchors future portfolio expansion.
Oncology delivered 78.19% of 2025 revenue and is expected to register 9.35% CAGR by 2031, making it the backbone of the HDAC inhibitors market. Confirmatory trial obligations for belinostat and tucidinostat may reshape this balance after 2030.
Neurology's foothold strengthened when givinostat won U.S. approval, demonstrating anti-fibrotic benefit in Duchenne muscular dystrophy. Pipeline assets in pulmonary arterial hypertension and idiopathic pulmonary fibrosis suggest a widening therapeutic canvas that supports longer treatment duration and cumulative sales.
Geography Analysis
North America contributed 58.17% revenue in 2025, helped by orphan pricing and specialty-pharmacy infrastructure. Givinostat's launch adds a chronic neuromuscular revenue stream with therapy costs exceeding USD 300,000 annually. Post-marketing withdrawals for romidepsin and panobinostat trimmed oncology growth, prompting sponsors to deepen real-world evidence collection at academic centers.
Asia-Pacific posts the fastest 9.37% CAGR, driven by China's 2025 dual-catalog reform that shielded innovative agents from volume-based price cuts. Tucidinostat has enjoyed NRDL presence since 2017 and new lymphoma approvals, while Japan's April 2025 price cut still leaves room for uptake in its aging population.
Europe trails but could accelerate if the EMA clears resminostat for cutaneous T-cell lymphoma mid-2025, based on the RESMAIN study's 8.3-month progression-free survival. Conditional givinostat approval in June 2025 adds non-oncology depth that may unlock reimbursement conversations in member states.
- Acrotech Biopharma LLC
- Bristol-Myers Squibb
- Cereno Scientific AB
- Chong Kun Dang Pharmaceutical Corp
- Curis, Inc
- HUYABIO International, LLC
- Italfarmaco S.p.A.
- Karus Therapeutics Ltd
- Medivir
- MEI Pharma, Inc
- Meiji Seika Pharma Co., Ltd
- Merck
- Novartis
- OnKure Therapeutics, Inc.
- Regenacy Pharmaceuticals, Inc.
- Shenzhen Chipscreen Biosciences Co., Ltd.
- Syndax Pharmaceuticals, Inc.
- Xynomic Pharmaceuticals Holdings, Inc.
Additional Benefits:
- The market estimate (ME) sheet in Excel format
- 3 months of analyst support
TABLE OF CONTENTS
1 Introduction
- 1.1 Study Assumptions & Market Definition
- 1.2 Scope of the Study
2 Research Methodology
3 Executive Summary
4 Market Landscape
- 4.1 Market Overview
- 4.2 Market Drivers
- 4.2.1 Expanding Oncology Indications and Orphan Approvals
- 4.2.2 Shift Toward Oral HDAC Inhibitors (Greater Convenience, Adherence)
- 4.2.3 Combination Regimens with ICIs And Proteasome Inhibitors
- 4.2.4 Expanding Clinical Pipeline and Trial Footprint
- 4.2.5 Non-Oncology Expansion (E.G., DMD) Broadening Patient Base
- 4.2.6 Rise Of HDAC6-Selective Agents Enabling Chronic/Combination Use
- 4.3 Market Restraints
- 4.3.1 Class Toxicity and Narrow Therapeutic Window Limit Dosing
- 4.3.2 Modest Monotherapy Efficacy in Solid Tumors Slows Uptake
- 4.3.3 Indication Withdrawals Narrow Labels and Dampen Confidence
- 4.3.4 Cardiac/QT And Drug-Drug Interaction Risks Constrain Use
- 4.4 Supply Chain Analysis
- 4.5 Regulatory Landscape
- 4.6 Technological Outlook
- 4.7 Porter's Five Forces Analysis
- 4.7.1 Threat of New Entrants
- 4.7.2 Bargaining Power of Suppliers
- 4.7.3 Bargaining Power of Buyers
- 4.7.4 Threat of Substitutes
- 4.7.5 Competitive Rivalry
5 Market Size & Growth Forecasts (Value, USD)
- 5.1 By Drug Class
- 5.1.1 Hydroxamic Acid Derivatives
- 5.1.2 Cyclic Peptides
- 5.1.3 Benzamides
- 5.1.4 HDAC6-Selective Inhibitors
- 5.1.5 Short-Chain Fatty Acids
- 5.2 By Application
- 5.2.1 Oncology
- 5.2.2 Neurology
- 5.2.3 Others
- 5.3 By Route of Administration
- 5.3.1 Oral
- 5.3.2 Intravenous
- 5.3.3 Topical
- 5.4 By Distribution Channel
- 5.4.1 Hospital Pharmacies
- 5.4.2 Retail & Specialty Pharmacies
- 5.4.3 Online pharmacies
- 5.5 By Geography
- 5.5.1 North America
- 5.5.1.1 United States
- 5.5.1.2 Canada
- 5.5.1.3 Mexico
- 5.5.2 Europe
- 5.5.2.1 Germany
- 5.5.2.2 United Kingdom
- 5.5.2.3 France
- 5.5.2.4 Italy
- 5.5.2.5 Spain
- 5.5.2.6 Rest of Europe
- 5.5.3 Asia-Pacific
- 5.5.3.1 China
- 5.5.3.2 India
- 5.5.3.3 Japan
- 5.5.3.4 South Korea
- 5.5.3.5 Australia
- 5.5.3.6 Rest of APAC
- 5.5.4 Middle East & Africa
- 5.5.4.1 GCC
- 5.5.4.2 South Africa
- 5.5.4.3 Rest of MEA
- 5.5.5 South America
- 5.5.5.1 Brazil
- 5.5.5.2 Argentina
- 5.5.5.3 Rest of South America
- 5.5.1 North America
6 Competitive Landscape
- 6.1 Market Concentration
- 6.2 Market Share Analysis
- 6.3 Company Profiles (includes Global level Overview, Market Level Overview, Core Segments, Financials as Available, Strategic Information, Market Rank/Share for Key Companies, Products & Services, and Recent Developments)
- 6.3.1 Acrotech Biopharma LLC
- 6.3.2 Bristol Myers Squibb Company
- 6.3.3 Cereno Scientific AB
- 6.3.4 Chong Kun Dang Pharmaceutical Corp
- 6.3.5 Curis, Inc
- 6.3.6 HUYABIO International, LLC
- 6.3.7 Italfarmaco S.p.A.
- 6.3.8 Karus Therapeutics Ltd
- 6.3.9 Medivir AB
- 6.3.10 MEI Pharma, Inc
- 6.3.11 Meiji Seika Pharma Co., Ltd
- 6.3.12 Merck & Co., Inc
- 6.3.13 Novartis AG
- 6.3.14 OnKure Therapeutics, Inc.
- 6.3.15 Regenacy Pharmaceuticals, Inc.
- 6.3.16 Shenzhen Chipscreen Biosciences Co., Ltd.
- 6.3.17 Syndax Pharmaceuticals, Inc.
- 6.3.18 Xynomic Pharmaceuticals Holdings, Inc.
7 Market Opportunities & Future Outlook
- 7.1 White-space & unmet-need assessment

