
PUBLISHER: Mordor Intelligence | PRODUCT CODE: 2063900

PUBLISHER: Mordor Intelligence | PRODUCT CODE: 2063900
Green Fertilizer - Market Share Analysis, Industry Trends & Statistics, Growth Forecasts (2026 - 2031)
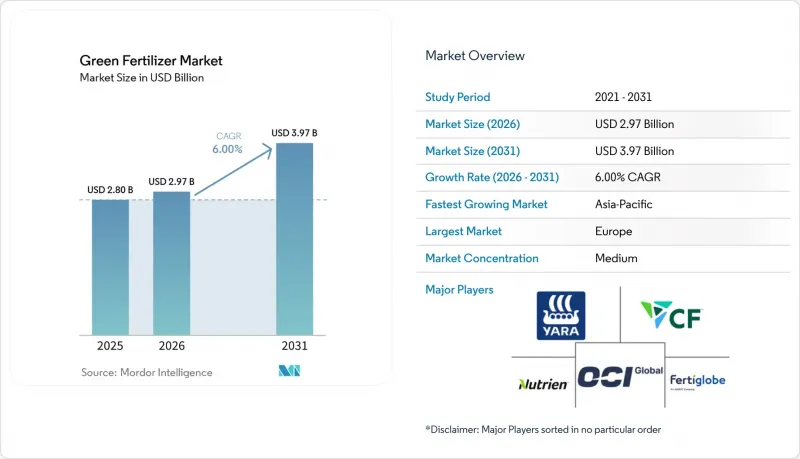
According to Mordor Intelligence, the green fertilizer market size is projected to grow from USD 2.80 billion in 2025 to USD 2.97 billion in 2026 and is anticipated to reach USD 3.97 billion by 2031, registering a CAGR of 6.0% during the period 2026-2031.
This report is Segmented by Fertilizer Type (Green Ammonia, Green Urea, and More), by Source Technology (Electrolytic Hydrogen, Biomass Gasification, and More), by Form (Solid and Liquid), by Crop Type (Cereals and Grains, Fruits and Vegetables, and More), and by Geography (North America, South America, Europe, Asia-Pacific, Middle East, and Africa). The Market Forecasts are Provided in Terms of Value (USD).
Global Green Fertilizer Market Trends and Insights
Carbon-Neutral Fertilizer Mandates
Carbon-neutral fertilizer mandates are driving the adoption of low-emission nitrogen inputs through binding regulatory frameworks. According to the European Commission, the Effort Sharing Regulation (ESR) requires EU member states to achieve a 40% reduction in greenhouse gas emissions by 2030 in non-Emissions Trading System (ETS) sectors, including agriculture. This regulation is compelling fertilizer producers to decarbonize production processes and transition to green ammonia and renewable-based inputs to meet regulatory deadlines and avoid carbon-related penalties.
Renewable-Power Cost Parity
Reductions in renewable power costs play a crucial role in improving the economics of green fertilizers by decreasing hydrogen production expenses. According to the International Energy Agency's Global Hydrogen Review 2024, the cost gap between low-emissions hydrogen and fossil-based hydrogen is projected to shrink from USD 1.5-8/kg in 2024 to USD 1-3/kg by 2030 . This reduction is primarily attributed to the availability of low-cost renewable electricity and the scaling up of electrolyzer deployment. The narrowing cost gap enhances the competitiveness of green ammonia and fertilizers, particularly in regions with abundant and affordable solar and wind energy resources, such as the Middle East, Australia, and Chile.
High Capital Intensity of Electrolyzers Above 1 GW
High capital intensity remains a significant barrier to the development of large-scale green fertilizer projects, primarily due to delays in project realization and financing difficulties. According to the International Energy Agency's Global Hydrogen Review 2024, only approximately 4% of the global electrolyzer project pipeline estimated at around 520 GW by 2030 has reached the final investment decision stage or is under construction. This underscores the considerable investment and execution challenges faced by the industry. The limited transition from announced capacity to operational projects highlights the substantial capital demands and financial risks associated with gigawatt-scale electrolyzer facilities, thereby hindering the expansion of green hydrogen production and its downstream application in green fertilizer manufacturing.
Other drivers and restraints analyzed in the detailed report include:
- Corporate Net-Zero Farming Programs
- Ammonia Bunkering Demand Pull-Through for Maritime Fuel
- Grid Congestion Limiting Renewable Power Purchase Agreements in Key Hubs
For complete list of drivers and restraints, kindly check the Table Of Contents.
Segment Analysis
Green ammonia held the largest 46.0% of the green fertilizer market share in 2025, supported by compatibility with existing ammonia-based fertilizer infrastructure and its dual application across agriculture and emerging fuel markets. Its scalability is supported by established production methods, such as retrofitting the Haber-Bosch process with renewable hydrogen. At the same time, bio-based potash is gaining momentum due to regulatory support for waste-derived nutrients and its contribution to sustainable soil management. These factors collectively reinforce ammonia's market dominance while positioning potash as a niche but rapidly growing segment.
Bio-based potash market size is projected to grow at the fastest 9.0% CAGR from 2026 to 2031, driven by increasing adoption of circular nutrient recovery systems and demand for sustainable alternatives in high-value crops. Growth is further supported by policy incentives promoting the use of recycled and bio-based inputs. In contrast, ammonia benefits from scale advantages due to established logistics and widespread agronomic acceptance. This creates a dual-track market structure, with ammonia dominating in volume while bio-based potash expands in premium and environmentally regulated applications.
Electrolytic hydrogen (renewable energy) accounted for the largest 54.0% of the green fertilizer market share in 2025, supported by strong policy backing and increasing deployment of renewable-powered hydrogen production systems. Its prominence is attributed to its scalability and alignment with decarbonization goals across the energy and agriculture industries. Additionally, waste-derived hydrogen pathways are gaining traction due to their ability to utilize municipal and industrial waste streams, enabling localized production and supporting circular economy initiatives.
Waste-to-hydrogen is projected to grow at the fastest 10.0% CAGR from 2026 to 2031, driven by increasing interest in resource efficiency and waste management solutions. While electrolysis remains dominant due to well-defined regulatory frameworks and steady investment, waste-based hydrogen production is expanding in regions with abundant feedstock availability. This trend highlights a geographic distinction, with renewable-rich areas favoring electrolysis and waste-dense regions adopting alternative hydrogen production technologies.
Geography Analysis
Europe accounted for the largest 32.0% of the green fertilizer market share in 2025, driven by robust regulatory frameworks and the early adoption of low-emission agricultural inputs. Carbon pricing mechanisms and sustainability mandates are facilitating the shift toward renewable-based fertilizer production. Countries like Germany and the Netherlands are integrating renewable energy with hydrogen and ammonia production systems, thereby strengthening regional supply chains. Although grid constraints and policy differences exist across countries, consistent regulatory pressure continues to support the region's leadership in sustainable fertilizer adoption.
The Asia-Pacific region is projected to grow at the fastest CAGR of 7.8% from 2026 to 2031, driven by rapid industrialization and strong government initiatives promoting clean energy integration. Countries such as China, India, and Australia are expanding renewable hydrogen capacity to support fertilizer production. The region benefits from abundant solar and wind resources, which provide cost advantages, while policy-driven investments are accelerating infrastructure development. Despite challenges such as water availability and grid limitations, the region remains a key growth driver due to its scale and resource availability.
North America is advancing low-carbon fertilizer value chains through robust policy incentives and cross-border trade dynamics. The clean hydrogen production tax credit under Section 45V provides up to USD 3.00 per kilogram of hydrogen for a 10-year period, enhancing project economics and facilitating retrofits across the Gulf Coast and Midwest . Canada is progressing with blue-ammonia export strategies, while Mexico is assessing imports from the United States Southwest. Simultaneously, the Middle East is developing large-scale renewable-powered ammonia projects, positioning itself as a significant export hub for Europe and Asia.
- Yara International ASA
- CF Industries Holdings Inc.
- OCI N.V.
- Fertiglobe PLC
- Nutrien Ltd.
- ACME Group
- Air Products and Chemicals Inc.
- Engie SA
- Iberdrola S.A.
- thyssenkrupp AG
- Siemens Energy AG
- Nel ASA
- AmmPower Corp.
- Avina Clean Hydrogen Inc.
- Casale SA
Additional Benefits:
- The market estimate (ME) sheet in Excel format
- 3 months of analyst support
TABLE OF CONTENTS
1 Introduction
- 1.1 Study Assumptions and Market Definition
- 1.2 Scope of the Study
2 Research Methodology
3 Executive Summary
4 Market Landscape
- 4.1 Market Overview
- 4.2 Market Drivers
- 4.2.1 Carbon-neutral fertilizer mandates
- 4.2.2 Renewable-power cost parity
- 4.2.3 Corporate net-zero farming programs
- 4.2.4 Ammonia bunkering demand pull-through for maritime fuel
- 4.2.5 Carbon border adjustment mechanisms
- 4.2.6 Green-hydrogen tax credits in the United States
- 4.3 Market Restraints
- 4.3.1 High capital intensity of electrolyzers above 1 GW
- 4.3.2 Grid congestion limiting renewable Power Purchase Agreements in key hubs
- 4.3.3 Scarcity of certified green water resources in arid zones
- 4.3.4 Slow agronomic validation data for novel formulations
- 4.4 Regulatory Landscape
- 4.5 Technological Outlook
- 4.6 Porter's Five Forces
- 4.6.1 Bargaining Power of Suppliers
- 4.6.2 Bargaining Power of Buyers
- 4.6.3 Threat of New Entrants
- 4.6.4 Threat of Substitutes
- 4.6.5 Competitive Rivalry
5 Market Size and Growth Forecasts (Value, 2026-2031)
- 5.1 By Fertilizer Type
- 5.1.1 Green Ammonia
- 5.1.2 Green Urea
- 5.1.3 Green Phosphate
- 5.1.4 Bio-based Potash
- 5.1.5 Others
- 5.2 By Source Technology
- 5.2.1 Electrolytic Hydrogen (Renewable Energy)
- 5.2.2 Biomass Gasification
- 5.2.3 Waste-to-Hydrogen
- 5.2.4 Other Emerging Technologies
- 5.3 By Form
- 5.3.1 Solid
- 5.3.2 Liquid
- 5.4 By Crop Type
- 5.4.1 Cereals and Grains
- 5.4.2 Fruits and Vegetables
- 5.4.3 Oilseeds and Pulses
- 5.4.4 Others
- 5.5 By Region
- 5.5.1 North America
- 5.5.1.1 United States
- 5.5.1.2 Canada
- 5.5.1.3 Mexico
- 5.5.1.4 Rest of North America
- 5.5.2 South America
- 5.5.2.1 Brazil
- 5.5.2.2 Argentina
- 5.5.2.3 Rest of South America
- 5.5.3 Europe
- 5.5.3.1 Germany
- 5.5.3.2 France
- 5.5.3.3 United Kingdom
- 5.5.3.4 Italy
- 5.5.3.5 Spain
- 5.5.3.6 Russia
- 5.5.3.7 Rest of Europe
- 5.5.4 Asia-Pacific
- 5.5.4.1 China
- 5.5.4.2 Japan
- 5.5.4.3 India
- 5.5.4.4 South Korea
- 5.5.4.5 Australia and New Zealand
- 5.5.4.6 Rest of Asia-Pacific
- 5.5.5 Middle East
- 5.5.5.1 Saudi Arabia
- 5.5.5.2 United Arab Emirates
- 5.5.5.3 Turkey
- 5.5.5.4 Rest of Middle East
- 5.5.6 Africa
- 5.5.6.1 South Africa
- 5.5.6.2 Egypt
- 5.5.6.3 Rest of Africa
- 5.5.1 North America
6 Competitive Landscape
- 6.1 Market Concentration
- 6.2 Strategic Moves
- 6.3 Market Share Analysis
- 6.4 Company Profiles (Includes Global-Level Overview, Market-Level Overview, Core Segments, Financials as Available, Strategic Information, Market Rank/Share for Key Companies, Products and Services, and Recent Developments)
- 6.4.1 Yara International ASA
- 6.4.2 CF Industries Holdings Inc.
- 6.4.3 OCI N.V.
- 6.4.4 Fertiglobe PLC
- 6.4.5 Nutrien Ltd.
- 6.4.6 ACME Group
- 6.4.7 Air Products and Chemicals Inc.
- 6.4.8 Engie SA
- 6.4.9 Iberdrola S.A.
- 6.4.10 thyssenkrupp AG
- 6.4.11 Siemens Energy AG
- 6.4.12 Nel ASA
- 6.4.13 AmmPower Corp.
- 6.4.14 Avina Clean Hydrogen Inc.
- 6.4.15 Casale SA
7 Market Opportunities and Future Outlook

