PUBLISHER: Mordor Intelligence | PRODUCT CODE: 2065789

PUBLISHER: Mordor Intelligence | PRODUCT CODE: 2065789
Barge Transportation - Market Share Analysis, Industry Trends & Statistics, Growth Forecasts (2026 - 2031)
According to Mordor Intelligence, the barge transportation market size is projected to be USD 15.60 billion in 2025, USD 16.91 billion in 2026, and reach USD 25.29 billion by 2031, growing at a CAGR of 8.37% from 2026 to 2031.
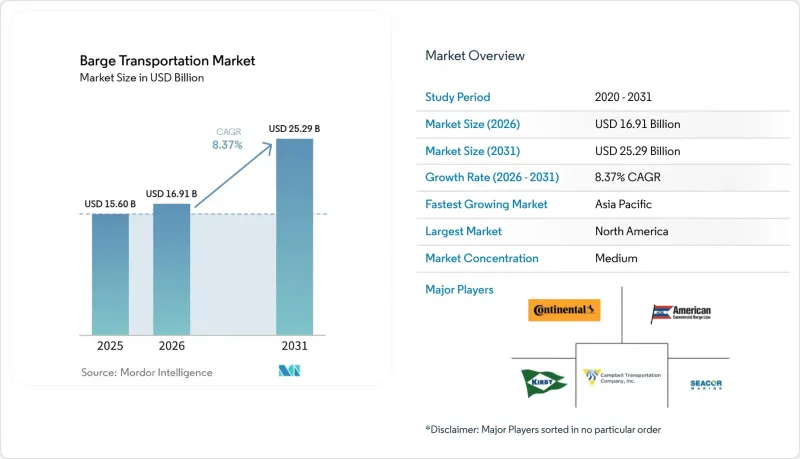
This report Segments the Industry Into by Barge Fleet Type (Dry Cargo Barges, Liquid Cargo Barges and Specialty Barges), by Cargo / End-Use Industry (Agricultural Products, Coal & Crude Petroleum Products, Chemicals & Fertilizers and More), by Barging Activity (Inland / Domestic and Coastal / Ocean-Going), and Geography (North America, and More). The Market Forecasts are Provided in Terms of Value (USD).
Global Barge Transportation Market Trends and Insights
Expansion of global seaborne trade driving inland waterway utilization
Cargo volumes handled at coastal ports continue to climb, propelling first- and last-mile demand for inland barge moves. Barges generate 89% lower greenhouse-gas emissions per ton-mile than trucks, which aligns with shipper sustainability targets. At DP World Antwerp, management reports that 35% of containers already depart by barge, reducing terminal congestion. Similar initiatives are expanding in the Gulf of Mexico and the Yangtze River Delta as ports look to preserve throughput by shifting hinterland flows onto water. Governments reinforce the shift by prioritizing dredging and lock upgrades in long-range infrastructure plans. Continuous integration of port community systems with inland terminals underpins reliable scheduling and quicker turnarounds, giving the barge transportation market further momentum.
Cost advantage amplifying appeal amid fuel price volatility
Inland barges achieve 514 ton-miles per gallon, far outperforming rail and truck alternatives. A single 15-barge tow displaces roughly 1,050 trucks, which lowers freight bills at a time when diesel prices are trending higher. Princeton TMX analysis shows the total landed cost for bulk shippers can fall by 20% when loads migrate from highway to waterways. As energy markets remain volatile, contract shippers lock in multiyear barge capacity to secure predictability. These savings cascade through supply chains, encouraging commodity producers to reconfigure distribution footprints around river ports that offer efficient multimodal interchange.
Aging infrastructure creating operational bottlenecks
More than 80% of United States locks have exceeded the original 50-year design horizon, triggering frequent closures that delay voyages and raise costs. A study on the Mississippi's Lock 25 warned that a 30-day outage could trim national GDP by USD 3.1 billion. Although the Infrastructure Investment and Jobs Act channels USD 2.9 billion into inland construction, the maintenance backlog remains large. Europe faces a comparable challenge on the Danube where aging structures restrict draft during peak demand. Unplanned downtime erodes schedule reliability and encourages some shippers to hedge with rail contracts, dampening the barge transportation market.
Other drivers and restraints analyzed in the detailed report include:
- Growing biofuel and chemical movements requiring specialized tank barges
- Digitalization and autonomous-navigation technologies boosting fleet productivity
- Climate variability disrupting navigation and service reliability
For complete list of drivers and restraints, kindly check the Table Of Contents.
Segment Analysis
Dry cargo barges moved the largest share of bulk goods in 2025 and held 47.55% of barge transportation market share. Grain, coal and metal ores dominate their manifests because these vessels optimize cubic capacity and incur low unit operating cost. Fleet demand tracks harvest and energy cycles, and operators stretch asset lives through standard maintenance. Specialty barges are rising quickly, posting a forecast 8.92% CAGR as shipyards deliver LNG bunkering, accommodation and carbon-capture hulls that serve new niches. The first LNG bunkering hub on the Texas City Ship Channel, approved in May 2025, will invest at least USD 300 million in vessels and shore facilities. Regulatory certainty on alternative fuels, plus higher charter rates for purpose-built units, underpins long-term equipment orders that lift the barge transportation market.
Tank barges dedicated to chemicals and petroleum remain profitable because safety compliance differentiates service. The American Bureau of Shipping issued strict guidelines on LNG and methanol fueling systems, enabling owners to qualify for premium contracts. Carbon-capture demonstration programs envision liquefied CO2 barges operating on the Gulf Intracoastal Waterway, hinting at fresh demand pools. Continuous investment in coatings, vapor-control consoles and real-time monitoring keeps barriers to entry high, preserving utilization and margins within this slice of the barge transportation industry.
Geography Analysis
North America generated 41.60% of 2025 revenue, anchored by the Mississippi, Ohio and Illinois rivers. Federal allocations of USD 2.9 billion for inland upgrades improve lock reliability and draft availability, and 2022 cargo throughput surpassed 257 million tons despite historic low water. Ingram Barge Company's addition of more than 1,000 barges from SEACOR scales its network to meet durable demand. Autonomous pilots, as tested by Mythos AI, could unlock further efficiency once United States Coast Guard rules on remote operations mature.
Asia-Pacific holds the strongest near-term growth outlook in the barge transportation market with an 7.18% CAGR. China pours resources into deepening the Yangtze, and local authorities streamline barge-truck transfers at inland ports to remove bottlenecks. The Regional Comprehensive Economic Partnership encourages regional production shifts that move more intermediate goods on waterways. In Southeast Asia, maritime freight already accounts for 61% of trade value, and new intermodal corridors extend barge reach into land-locked provinces.
Europe remains pivotal in the barge transportation market, underpinned by Rotterdam and Antwerp-Bruges which together add EUR 50 billion of value annually. The NAIADES programme seeks a 25% jump in inland volumes by 2030, requiring zero-emission vessels and smart traffic management. Yet climate-related low Rhine levels periodically divert freight to rail, showing the vulnerability of river transport. Investment in lock deepening and automated water-level forecasting is therefore a policy priority that safeguards the barge transportation market.
South America emerges as an agricultural export powerhouse with soy and corn flows shifting steadily toward barges. Corn exports that used barges rose from 3% to 16% between 2010 and 2023, reflecting freight savings on the Tapajos and Madeira rivers. PALFINGER MARINE's Brazilian iron-ore program demonstrates how mining drives additional barge demand. Debate over wetland protection along the Paraguay-Parana waterway shows environmental scrutiny is intensifying, which could shape permitting timelines for future projects.
- Kirby Corporation
- Ingram Marine Group
- American Commercial Barge Line (ACBL)
- SEACOR Holdings Inc.
- Campbell Transportation Company
- Canal Barge Company
- SCF Marine Inc.
- Blessey Marine Services
- Florida Marine Transporters
- PACC Offshore Services Holdings (POSH)
- PT Pelayaran Nasional Indonesia (PELNI)
- Rhenus Group
- Danube Shipping Management Service GmbH
- Imperial Logistics International
- VTG AG
- GAC Saudi Arabia
- Qinhuangdao Tianhang Shipping Co.
- Simatech Shipping LLC
- Mercuria Energy Group (Stema Shipping)
- Hvide Sande Supply (Esbjerg)*
Additional Benefits:
- The market estimate (ME) sheet in Excel format
- 3 months of analyst support
TABLE OF CONTENTS
1 Introduction
- 1.1 Study Assumptions & Market Definition
- 1.2 Scope of the Study
2 Research Methodology
3 Executive Summary
4 Market Landscape
- 4.1 Market Overview
- 4.2 Market Drivers
- 4.2.1 Expansion of global seaborne trade shifting first/last-mile volumes to inland waterways
- 4.2.2 Cost advantage of barges over rail & trucking amid rising fuel prices
- 4.2.3 Growing biofuel and chemical movements requiring specialized tank barges
- 4.2.4 Digitalization and autonomous-navigation technologies boosting fleet productivity
- 4.2.5 International climate policies favoring low-emission waterborne freight
- 4.2.6 Rising global investment in dredging and lock modernization projects
- 4.3 Market Restraints
- 4.3.1 Aging inland waterway infrastructure causing congestion and downtime
- 4.3.2 Climate-driven water-level variability undermining service reliability
- 4.3.3 High capital cost of low-emission barge newbuilds and retrofits
- 4.3.4 Intensifying competition from upgraded rail freight corridors
- 4.4 Value / Supply-Chain Analysis
- 4.5 Regulatory or Technological Outlook
- 4.6 Porter's Five Forces
- 4.6.1 Threat of New Entrants
- 4.6.2 Bargaining Power of Suppliers
- 4.6.3 Bargaining Power of Buyers
- 4.6.4 Threat of Substitutes
- 4.6.5 Competitive Rivalry
5 Market Size & Growth Forecasts (Value)
- 5.1 By Barge Fleet Type
- 5.1.1 Dry Cargo Barges
- 5.1.2 Liquid Cargo Barges
- 5.1.3 Specialty Barges
- 5.2 By Cargo / End-use Industry
- 5.2.1 Agricultural Products
- 5.2.2 Coal & Crude Petroleum Products
- 5.2.3 Chemicals & Fertilizers
- 5.2.4 Metal Ores & Alloys
- 5.2.5 Project & Oversized Cargo
- 5.2.6 Others
- 5.3 By Barging Activity
- 5.3.1 Inland / Domestic
- 5.3.2 Coastal / Ocean-going
- 5.4 By Geography
- 5.4.1 North America
- 5.4.1.1 United States
- 5.4.1.2 Canada
- 5.4.1.3 Mexico
- 5.4.2 South America
- 5.4.2.1 Brazil
- 5.4.2.2 Peru
- 5.4.2.3 Chile
- 5.4.2.4 Argentina
- 5.4.2.5 Rest of South America
- 5.4.3 Asia Pacific
- 5.4.3.1 India
- 5.4.3.2 China
- 5.4.3.3 Japan
- 5.4.3.4 Australia
- 5.4.3.5 South Korea
- 5.4.3.6 South East Asia (Singapore, Malaysia, Thailand, Indonesia, Vietnam, and Philippines)
- 5.4.3.7 Rest of Asia-Pacific
- 5.4.4 Europe
- 5.4.4.1 United Kingdom
- 5.4.4.2 Germany
- 5.4.4.3 France
- 5.4.4.4 Spain
- 5.4.4.5 Italy
- 5.4.4.6 BENELUX (Belgium, Netherlands, and Luxembourg)
- 5.4.4.7 NORDICS (Denmark, Finland, Iceland, Norway, and Sweden)
- 5.4.4.8 Rest of Europe
- 5.4.5 Middle East And Africa
- 5.4.5.1 United Arab of Emirates
- 5.4.5.2 Saudi Arabia
- 5.4.5.3 South Africa
- 5.4.5.4 Nigeria
- 5.4.5.5 Rest of Middle East And Africa
- 5.4.1 North America
6 Competitive Landscape
- 6.1 Market Concentration
- 6.2 Strategic Moves
- 6.3 Market Share Analysis
- 6.4 Company Profiles (includes Global level Overview, Market level overview, Core Segments, Financials as available, Strategic Information, Market Rank/Share for key companies, Products & Services, and Recent Developments)
- 6.4.1 Kirby Corporation
- 6.4.2 Ingram Marine Group
- 6.4.3 American Commercial Barge Line (ACBL)
- 6.4.4 SEACOR Holdings Inc.
- 6.4.5 Campbell Transportation Company
- 6.4.6 Canal Barge Company
- 6.4.7 SCF Marine Inc.
- 6.4.8 Blessey Marine Services
- 6.4.9 Florida Marine Transporters
- 6.4.10 PACC Offshore Services Holdings (POSH)
- 6.4.11 PT Pelayaran Nasional Indonesia (PELNI)
- 6.4.12 Rhenus Group
- 6.4.13 Danube Shipping Management Service GmbH
- 6.4.14 Imperial Logistics International
- 6.4.15 VTG AG
- 6.4.16 GAC Saudi Arabia
- 6.4.17 Qinhuangdao Tianhang Shipping Co.
- 6.4.18 Simatech Shipping LLC
- 6.4.19 Mercuria Energy Group (Stema Shipping)
- 6.4.20 Hvide Sande Supply (Esbjerg)*
7 Market Opportunities & Future Outlook

