
PUBLISHER: Mordor Intelligence | PRODUCT CODE: 2066402

PUBLISHER: Mordor Intelligence | PRODUCT CODE: 2066402
Biostimulants - Market Share Analysis, Industry Trends & Statistics, Growth Forecasts (2026 - 2031)
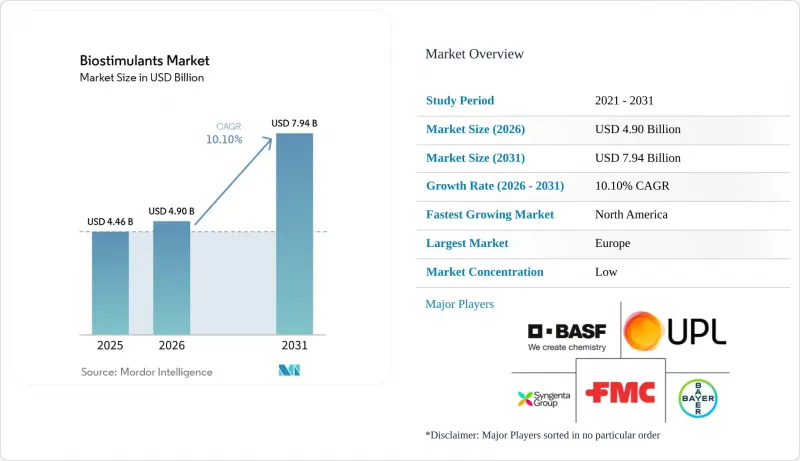
According to Mordor Intelligence, the biostimulants market size is projected to grow from USD 4.46 billion in 2025 to USD 4.90 billion in 2026 and reach USD 7.94 billion by 2031, registering a CAGR of 10.1% during 2026-2031.
This report is Segmented by Form (Amino Acids, Fulvic Acid, Humic Acid, Protein Hydrolysates, Seaweed Extracts, and More), by Crop Type (Cash Crops, Horticultural Crops, and Row Crops), and by Geography (North America, South America, Europe, Asia-Pacific, Middle East, and Africa). The Market Forecasts are Provided in Terms of Value (USD) and Volume (Metric Tons).
Global Biostimulants Market Trends and Insights
Sustainable Crop-Input Adoption
The adoption of sustainable crop inputs remains a key driver of demand in the biostimulants market, as it aligns with both current farm economics and agronomic requirements. Fertilizer price volatility following the COVID-19 pandemic has influenced growers to reassess input decisions. Many farms are now using biostimulants to enhance nutrient efficiency rather than as replacements for standard fertilizer programs. This shift is significant as it integrates biostimulants into core crop budgets, often resulting in repeat usage after initial trial cycles. A 2025 study by researchers from the University of Cordoba, Spain, demonstrated that amino acid biostimulants combined with slow-release urea increased grain protein content by up to 4.2% compared to untreated controls under semi-arid conditions.
Organic Acreage and Residue-Sensitive Value Chains
Organic acreage and residue-sensitive value chains are expanding the customer base of the biostimulants market beyond traditional crop systems. Retailer sourcing requirements are driving additional demand, as residue-free procurement standards often encourage growers to adopt biological solutions, even in the absence of formal regulatory mandates. According to the Economic Research Service of the United States Department of Agriculture, organic food sales reached USD 65.4 billion in 2024, indicating strong downstream demand. This is significant for the biostimulants market, as its adoption is no longer confined to a small organic segment. Row-crop growers and high-value horticultural producers are increasingly responding to similar buyer pressures from food and export markets.
Fragmented Global Definitions and Claim Rules
Fragmented legal definitions continue to constrain the biostimulants market in many regions outside Europe. In several countries across Africa, Southeast Asia, and South Asia, these products are regulated under pesticide-style statutes. This results in extended data requirements and prolonged registration timelines, which many suppliers find challenging to manage. According to the European Biostimulants Industry Council (EBIC), current compliance rules, including positive-list restrictions and chemical safety requirements, pose significant challenges, particularly for smaller companies aiming to commercialize new microbial solutions. This issue is closely tied to claim-enforcement risks, as suppliers may invest in product development only to encounter varying claim standards or differing product classifications across jurisdictions. Until a broader international framework is established, the biostimulants market is projected to grow unevenly, with regulatory differences influencing competition nearly as much as agronomic performance.
Other drivers and restraints analyzed in the detailed report include:
- Regulatory Recognition and Product-Legitimacy Gains
- Abiotic-Stress and Yield-Stability Proof Points
- Inconsistent Field Performance Across Conditions
For complete list of drivers and restraints, kindly check the Table Of Contents.
Segment Analysis
Amino acids held the largest 30.7% of revenue share in 2025. This dominance is attributed to their broad compatibility with fertigation systems, nutrient-efficiency programs, and stress-management applications across various crop categories. Amino acid formulations are widely used in cereals, vegetables, and horticultural crops due to their seamless integration into existing fertilizer schedules and crop-protection routines. The segment benefits from strong repeat-purchase behavior in commercial farming systems, where growers prioritize operational simplicity and measurable crop-quality improvements. Additionally, their stable shelf life, ease of handling, and increasing incorporation into biological input programs continue to drive adoption in large-scale agricultural production regions worldwide.
Humic acid is set to grow at the fastest 12.6% CAGR from 2026 to 2031. This growth is driven by rising concerns over soil degradation, nutrient-use efficiency, and drought-related crop stress in commercial agriculture. Humic acid formulations are increasingly adopted in corn, soybean, and cereal systems due to their ability to enhance nutrient availability and support root-zone activity under varying field conditions. Fulvic acid products are also gaining traction for their rapid plant interaction and chelation properties, while seaweed extracts remain significant for stress-management applications. Product innovation is increasingly focused on multi-active biological blends integrated into fertilizer and seed-treatment programs within mainstream agricultural production systems.
Geography Analysis
Europe accounted for the largest 38.3% of the market share in 2025. The region maintains leadership because the European Union regulation, which established a formal legal framework for plant biostimulants, has improved product standardization and cross-border commercialization. Europe also benefits from strong organic farming adoption and greater regulatory support for sustainable agricultural inputs. Countries including Spain, France, Germany, and Italy continue driving demand because their cereal, horticultural, olive, and wine industries prioritize residue management and export quality standards. Advanced agronomic advisory networks and stronger biological input awareness further support commercial adoption across both broadacre and high-value agricultural production systems throughout the region.
The North America market size is projected to grow at the fastest 12.7% CAGR from 2026 to 2031. Growth is supported by precision agriculture expansion, climate-smart farming programs, and increasing interest in nutrient-efficiency products across large-scale farming operations. The United States and Canada continue to increase biological input integration into corn, soybean, vegetable, and specialty-crop systems. Strong dealer infrastructure and advanced farm-management practices are also accelerating the adoption of biostimulant formulations linked to fertilizer optimization and stress management. Commercial growers increasingly evaluate these products through measurable agronomic outcomes rather than experimental use, strengthening recurring demand across row-crop and horticultural production systems throughout the regional agricultural sector.
The Asia-Pacific region is strengthening its position through the expansion of sustainable agriculture initiatives and increased adoption of biological inputs. According to the Press Information Bureau, Government of India, 146 biostimulant products had been included under Schedule VI of the Fertilizer Control Order (FCO) by September 2025 to regulate product quality, efficacy, and commercialization standards. India and China are actively supporting biological and sustainable nutrient-management programs to reduce reliance on conventional agricultural inputs. South America remains significant due to its export-oriented production systems for soybeans, coffee, and fruits. Meanwhile, the Middle East and Africa are witnessing the gradual adoption of biological inputs, driven by challenges such as drought stress, salinity exposure, and soil-quality management priorities.
- Syngenta Crop Protection AG (Syngenta Group)
- UPL Limited
- BASF SE
- Bayer AG
- FMC Corporation
- Rovensa Next S.L.
- Coromandel International Limited
- Koppert B.V.
- Haifa Negev Technologies Ltd. (Haifa Group)
- BioAtlantis Ltd.
- Acadian Seaplants Limited
- Seipasa, S.A.
- Hello Nature International S.r.l.
- Novonesis A/S
- PI Industries Limited
Additional Benefits:
- The market estimate (ME) sheet in Excel format
- 3 months of analyst support
TABLE OF CONTENTS
1 INTRODUCTION
- 1.1 Study Assumptions and Market Definition
- 1.2 Scope of the Study
- 1.3 Research Methodology
2 REPORT OFFERS
3 EXECUTIVE SUMMARY AND KEY FINDINGS
4 KEY INDUSTRY TRENDS
- 4.1 Area Under Organic Cultivation
- 4.2 Per Capita Spending on Organic Products
- 4.3 Regulatory Framework
- 4.3.1 Argentina
- 4.3.2 Australia
- 4.3.3 Brazil
- 4.3.4 Canada
- 4.3.5 China
- 4.3.6 Egypt
- 4.3.7 France
- 4.3.8 Germany
- 4.3.9 India
- 4.3.10 Indonesia
- 4.3.11 Italy
- 4.3.12 Japan
- 4.3.13 Mexico
- 4.3.14 Netherlands
- 4.3.15 Nigeria
- 4.3.16 Philippines
- 4.3.17 Russia
- 4.3.18 South Africa
- 4.3.19 Spain
- 4.3.20 Thailand
- 4.3.21 Turkey
- 4.3.22 United Kingdom
- 4.3.23 United States
- 4.3.24 Vietnam
- 4.4 Value Chain and Distribution Channel Analysis
- 4.5 Market Drivers
- 4.5.1 Sustainable crop-input adoption
- 4.5.2 Organic acreage and residue-sensitive value chains
- 4.5.3 Regulatory recognition and product-legitimacy gains
- 4.5.4 Abiotic-stress and yield-stability proof points
- 4.5.5 Carbon and nature-credit monetization pathways
- 4.5.6 Seed and fertilizer-program integration
- 4.6 Market Restraints
- 4.6.1 Fragmented global definitions and claim rules
- 4.6.2 Inconsistent field performance across conditions
- 4.6.3 Tighter claim-enforcement and reclassification risk
- 4.6.4 Seaweed feedstock concentration and harvest volatility
- 4.7 Technological Outlook
- 4.8 Porter's Five Forces Analysis
- 4.8.1 Bargaining Power of Buyers
- 4.8.2 Bargaining Power of Suppliers
- 4.8.3 Threat of New Entrants
- 4.8.4 Threat of Substitutes
- 4.8.5 Intensity of Competitive Rivalry
5 MARKET SIZE AND GROWTH FORECASTS (VALUE AND VOLUME)
- 5.1 By Form
- 5.1.1 Amino Acids
- 5.1.2 Fulvic Acid
- 5.1.3 Humic Acid
- 5.1.4 Protein Hydrolysates
- 5.1.5 Seaweed Extracts
- 5.1.6 Other Biostimulants
- 5.2 By Crop Type
- 5.2.1 Row Crops
- 5.2.2 Horticultural Crops
- 5.2.3 Cash Crops
- 5.3 By Geography
- 5.3.1 North America
- 5.3.1.1 United States
- 5.3.1.2 Canada
- 5.3.1.3 Mexico
- 5.3.1.4 Rest of North America
- 5.3.2 South America
- 5.3.2.1 Brazil
- 5.3.2.2 Argentina
- 5.3.2.3 Rest of South America
- 5.3.3 Europe
- 5.3.3.1 Germany
- 5.3.3.2 France
- 5.3.3.3 Italy
- 5.3.3.4 Spain
- 5.3.3.5 United Kingdom
- 5.3.3.6 Russia
- 5.3.3.7 Netherlands
- 5.3.3.8 Rest of Europe
- 5.3.4 Asia-Pacific
- 5.3.4.1 China
- 5.3.4.2 India
- 5.3.4.3 Japan
- 5.3.4.4 Australia
- 5.3.4.5 Indonesia
- 5.3.4.6 Thailand
- 5.3.4.7 Vietnam
- 5.3.4.8 Philippines
- 5.3.4.9 Rest of Asia-Pacific
- 5.3.5 Middle East
- 5.3.5.1 Saudi Arabia
- 5.3.5.2 Iran
- 5.3.5.3 Turkey
- 5.3.5.4 Rest of Middle East
- 5.3.6 Africa
- 5.3.6.1 South Africa
- 5.3.6.2 Egypt
- 5.3.6.3 Nigeria
- 5.3.6.4 Rest of Africa
- 5.3.1 North America
6 COMPETITIVE LANDSCAPE
- 6.1 Key Strategic Moves
- 6.2 Strategic Moves
- 6.3 Company Landscape
- 6.4 Company Profiles (Includes Global Level Overview, Market Level Overview, Core Segments, Financials as Available, Strategic Information, Market Rank/Share for Key Companies, Products and Services, and Recent Developments)
- 6.4.1 Syngenta Crop Protection AG (Syngenta Group)
- 6.4.2 UPL Limited
- 6.4.3 BASF SE
- 6.4.4 Bayer AG
- 6.4.5 FMC Corporation
- 6.4.6 Rovensa Next S.L.
- 6.4.7 Coromandel International Limited
- 6.4.8 Koppert B.V.
- 6.4.9 Haifa Negev Technologies Ltd. (Haifa Group)
- 6.4.10 BioAtlantis Ltd.
- 6.4.11 Acadian Seaplants Limited
- 6.4.12 Seipasa, S.A.
- 6.4.13 Hello Nature International S.r.l.
- 6.4.14 Novonesis A/S
- 6.4.15 PI Industries Limited
7 KEY STRATEGIC QUESTIONS FOR AGRICULTURAL BIOLOGICALS CEOS

