
PUBLISHER: Mordor Intelligence | PRODUCT CODE: 2066415

PUBLISHER: Mordor Intelligence | PRODUCT CODE: 2066415
India Freight And Logistics - Market Share Analysis, Industry Trends & Statistics, Growth Forecasts (2026 - 2031)
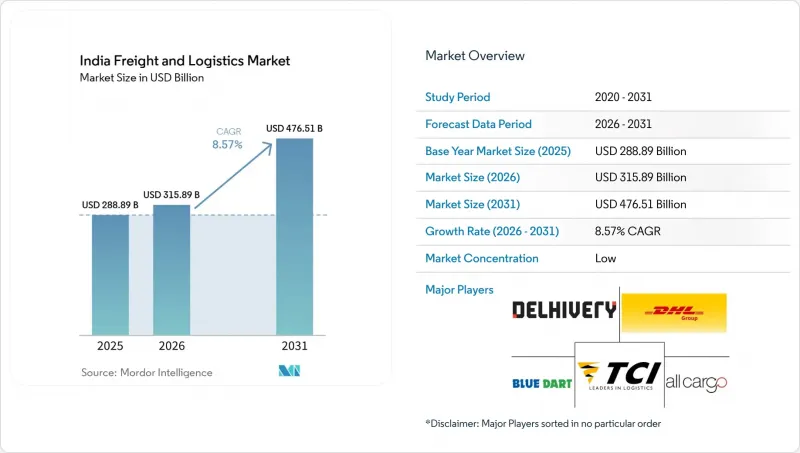
According to Mordor Intelligence, the india freight and logistics market size is expected to grow from USD 288.89 billion in 2025 to USD 315.89 billion in 2026 and is forecast to reach USD 476.51 billion by 2031 at 8.57% CAGR over 2026-2031.
This report is Segmented by End-User Industry (Agriculture, Fishing and Forestry, Construction, Manufacturing, Oil and Gas, Mining and Quarrying, Wholesale and Retail Trade, and Others) and by Logistics Function (Courier, Express, and Parcel (CEP), Freight Forwarding, Freight Transport, Warehousing and Storage, and Other Services). The Market Forecasts are Provided in Terms of Value (USD).
India Freight And Logistics Market Trends and Insights
Omnichannel and D2C Fulfilment Surge
Direct-to-consumer brands are fragmenting shipment sizes and driving demand for micro-fulfilment centers located within 15 kilometers of consumption clusters. Flipkart lifted its network to more than 1,400 fulfilment and sortation sites by 2024 to promise next-day delivery across 19,000 pin codes. Amazon India's "I Have Space" enlisted 28,000 kirana stores as last-mile nodes, lowering per-order costs up to 22%. Small D2C brands negotiate six-month warehousing contracts rather than multiyear leases, forcing 3PLs to build flexible capacity. Quick-commerce players such as Blinkit require urban dark stores within two kilometers of demand pockets, spurring zoning reforms and last-mile automation. Overall, rising D2C sales are propelling value-added services like kitting and same-day returns inside the India freight and logistics market .
Real-Time Visibility and Predictive ETA Mandate
Enterprise shippers now expect granular GPS feeds and machine-learning ETA updates instead of generic "in transit" statuses. Blue Dart connected IoT trackers across its 18,000-vehicle fleet in 2024, cutting customer queries by 31%. Container Corporation of India integrated its rail moves with the FOIS system, giving exporters real-time box locations at 60 inland depots. Mandatory FASTag tolling now produces 1.2 billion route data points each month, enabling load-matching engines to curb empty miles. Temperature-controlled fleets employ telematics to reduce cold-chain spoilage to near 4%. These visibility investments improve asset utilization and boost shipper loyalty within the India freight and logistics market .
Driver Shortage and High Attrition
A 22% gap between required and available commercial drivers in 2024 exacerbated delivery delays and wage inflation. Attrition among long-haul drivers rose to 38% because of arduous schedules and poor roadside amenities. Fatigue contributed to 12% of truck-related accidents, prompting insurers to raise premiums. Team-driving models lift labor costs by up to 50%, limiting viability to high-value cargo. Government training programs certified only 47,000 new drivers in 2024 against a target of 100,000. Without robust skilling incentives, personnel shortages will continue to suppress growth momentum in the India freight and logistics market .
Other drivers and restraints analyzed in the detailed report include:
- Flexible Delivery Windows and Anytime Returns
- Pharmaceutical Cold-Chain Integrity Demands
- Highly Fragmented Truck Ownership
For complete list of drivers and restraints, kindly check the Table Of Contents.
Segment Analysis
Wholesale and retail trade contributed 33.52% of revenue in 2025 and is forecast to grow at a 9.20% CAGR (2026-2031) as organized retail footprints broaden. Reliance Retail's automated sortation in eight distribution centers cut store replenishment cycles to 48 hours.
Manufacturing logistics hinges on just-in-time sequencing; Tata Motors reduced inventory to 2.8 days via a vendor-managed inventory program. Agricultural freight remains challenged by post-harvest losses of up to USD 14 billion annually due to weak rural road connectivity. Diverse sectoral needs continue to diversify revenue streams inside the India freight and logistics market.
Freight transport dominated with a 62.96% share in 2025; however, the CEP segment is scaling at a 9.92% CAGR (2026-2031) as e-commerce shipments climbed 29% in 2024. Delhivery's 100 sortation centers, each processing up to 100,000 parcels daily, illustrate the automation wave gripping CEP.
Asset-heavy freight carriers are deploying electric delivery vans to meet low-emission mandates; Blue Dart introduced 320 units in 2024 and cut per-drop emissions by 18%. India Post's Speed Post Express leverages 155,000 post offices to reach tier-3 towns, underscoring the market's long-tail opportunity. As parcel density rises, integrated warehousing and last-mile orchestration underpin competitive advantage inside the India freight and logistics market.
List of Companies Covered in this Report:
- Adani Ports and SEZ
- Allcargo Logistics, Ltd. (Including Gati Express)
- Amazon
- Blue Dart Express, Ltd.
- Busybees Logistics Solutions Pvt. Ltd.
- Container Corporation of India, Ltd.
- Delhivery, Ltd.
- DHL Group
- DSV A/S (Including DB Schenker)
- DTDC Express, Ltd.
- Ecom Express, Ltd.
- FedEx
- Flipkart Logistics
- Kuehne+Nagel
- LEAP India Pvt. Ltd.
- Mahindra Logistics, Ltd
- Redington, Ltd.
- Safexpress Pvt. Ltd.
- Shadowfax
- Snowman Logistics Ltd.
- TCI (Transport Corporation of India Ltd.)
- TVS Supply Chain Solutions Ltd.
- United Parcel Service of America, Inc. (UPS)
- VRL Logistics Ltd.
Additional Benefits:
- The market estimate (ME) sheet in Excel format
- 3 months of analyst support
TABLE OF CONTENTS
1 Introduction
- 1.1 Study Assumptions and Market Definition
- 1.2 Scope of the Study
2 Research Methodology
3 Executive Summary
4 Market Landscape
- 4.1 Market Overview
- 4.2 Demographics
- 4.3 GDP Distribution by Economic Activity
- 4.4 GDP Growth by Economic Activity
- 4.5 Inflation
- 4.6 Economic Performance and Profile
- 4.6.1 Trends in E-Commerce Industry
- 4.6.2 Trends in Manufacturing Industry
- 4.7 Transport and Storage Sector GDP
- 4.8 Export Trends
- 4.9 Import Trends
- 4.10 Fuel Price
- 4.11 Trucking Operational Costs
- 4.12 Trucking Fleet Size by Type
- 4.13 Logistics Performance
- 4.14 Modal Share
- 4.15 Maritime Fleet Load Carrying Capacity
- 4.16 Liner Shipping Connectivity
- 4.17 Port Calls and Performance
- 4.18 Freight Pricing Trends
- 4.19 Freight Tonnage Trends
- 4.20 Infrastructure
- 4.21 Regulatory Framework (Road and Rail)
- 4.22 Regulatory Framework (Sea and Air)
- 4.23 Value Chain and Distribution Channel Analysis
- 4.24 Market Drivers
- 4.24.1 Omnichannel and D2C Fulfilment Surge
- 4.24.2 Real-Time Visibility and Predictive ETA Mandate
- 4.24.3 Flexible Delivery Windows and "Anytime Returns"
- 4.24.4 Pharmaceutical Cold-Chain Integrity Demands
- 4.24.5 Defence and Aerospace Logistics Outsourcing Surge
- 4.24.6 Ultra-High Service-Level SLAs for Industrial OEMs
- 4.25 Market Restraints
- 4.25.1 Driver Shortage and High Attrition
- 4.25.2 Highly Fragmented Truck Ownership
- 4.25.3 Volatile Diesel and LNG Price Spread
- 4.25.4 Geopolitical Route Volatility (Red Sea / Panama)
- 4.26 Technological Outlook
- 4.27 Porter's Five Forces Analysis
- 4.27.1 Threat of New Entrants
- 4.27.2 Bargaining Power of Buyers
- 4.27.3 Bargaining Power of Suppliers
- 4.27.4 Threat of Substitutes
- 4.27.5 Competitive Rivalry
5 Market Size and Growth Forecasts (Value in USD)
- 5.1 By End-User Industry
- 5.1.1 Agriculture, Fishing, and Forestry
- 5.1.2 Construction
- 5.1.3 Manufacturing
- 5.1.4 Oil and Gas, Mining, and Quarrying
- 5.1.5 Wholesale and Retail Trade
- 5.1.6 Others
- 5.2 By Logistics Function
- 5.2.1 Courier, Express and Parcel (CEP)
- 5.2.1.1 By Destination Type
- 5.2.1.1.1 Domestic
- 5.2.1.1.2 International
- 5.2.1.1 By Destination Type
- 5.2.2 Freight Forwarding
- 5.2.2.1 By Mode of Transport
- 5.2.2.1.1 Air
- 5.2.2.1.2 Sea and Inland Waterways
- 5.2.2.1.3 Others
- 5.2.2.1 By Mode of Transport
- 5.2.3 Freight Transport
- 5.2.3.1 By Mode of Transport
- 5.2.3.1.1 Air
- 5.2.3.1.2 Pipelines
- 5.2.3.1.3 Rail
- 5.2.3.1.4 Road
- 5.2.3.1.5 Sea and Inland Waterways
- 5.2.3.1 By Mode of Transport
- 5.2.4 Warehousing and Storage
- 5.2.4.1 By Temperature Control
- 5.2.4.1.1 Non-Temperature-Controlled
- 5.2.4.1.2 Temperature-Controlled
- 5.2.4.1 By Temperature Control
- 5.2.5 Other Services
- 5.2.1 Courier, Express and Parcel (CEP)
6 Competitive Landscape
- 6.1 Market Concentration
- 6.2 Strategic Moves
- 6.3 Market Share Analysis
- 6.4 Company Profiles (includes Global Level Overview, Market Level Overview, Core Segments, Financials as Available, Strategic Information, Market Rank/Share for Key Companies, Products and Services, and Recent Developments)
- 6.4.1 Adani Ports and SEZ
- 6.4.2 Allcargo Logistics, Ltd. (Including Gati Express)
- 6.4.3 Amazon
- 6.4.4 Blue Dart Express, Ltd.
- 6.4.5 Busybees Logistics Solutions Pvt. Ltd.
- 6.4.6 Container Corporation of India, Ltd.
- 6.4.7 Delhivery, Ltd.
- 6.4.8 DHL Group
- 6.4.9 DSV A/S (Including DB Schenker)
- 6.4.10 DTDC Express, Ltd.
- 6.4.11 Ecom Express, Ltd.
- 6.4.12 FedEx
- 6.4.13 Flipkart Logistics
- 6.4.14 Kuehne+Nagel
- 6.4.15 LEAP India Pvt. Ltd.
- 6.4.16 Mahindra Logistics, Ltd
- 6.4.17 Redington, Ltd.
- 6.4.18 Safexpress Pvt. Ltd.
- 6.4.19 Shadowfax
- 6.4.20 Snowman Logistics Ltd.
- 6.4.21 TCI (Transport Corporation of India Ltd.)
- 6.4.22 TVS Supply Chain Solutions Ltd.
- 6.4.23 United Parcel Service of America, Inc. (UPS)
- 6.4.24 VRL Logistics Ltd.
7 Market Opportunities and Future Outlook
- 7.1 White-Space and Unmet-Need Assessment

