
PUBLISHER: Mordor Intelligence | PRODUCT CODE: 2066423

PUBLISHER: Mordor Intelligence | PRODUCT CODE: 2066423
Small Satellite - Market Share Analysis, Industry Trends & Statistics, Growth Forecasts (2026 - 2031)
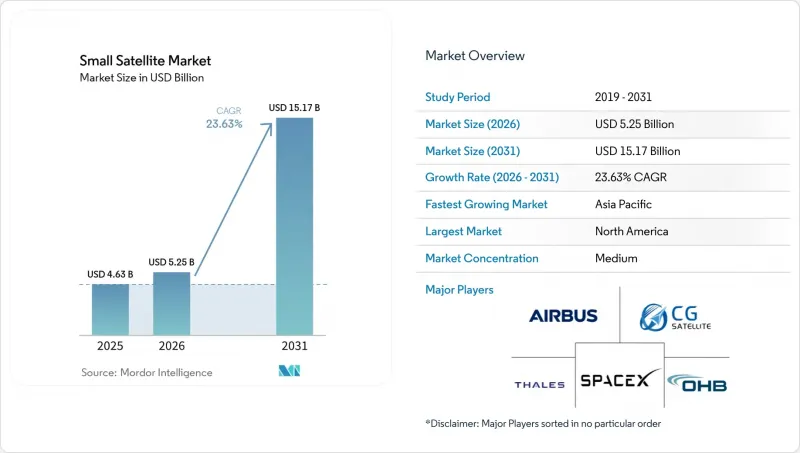
According to Mordor Intelligence, the small satellite market size is expected to grow from USD 4.63 billion in 2025 to USD 5.25 billion in 2026 and is forecast to reach USD 15.17 billion by 2031 at a 23.63% CAGR over 2026-2031.
This report is Segmented by Application (Communication, Earth Observation, Navigation, Space Observation, and Others), Orbit (LEO, MEO, and GEO), End-User (Commercial, Government and Civil, and Military), Satellite Mass (Femtosatellites, Picosatellites, Nanosatellites, and More), and Geography (North America, Europe, Asia-Pacific, and More). The Market Forecasts are Provided in Terms of Value (USD).
Global Small Satellite Market Trends and Insights
Reusable-launch cost collapse
The adoption of reusable launch systems, initiated by SpaceX, has substantially reduced the cost of space access. Reusable first stages from operators such as Rocket Lab and SpaceX have broken the historic link between payload mass and launch expense. Reusable rockets can be launched multiple times, achieving cost savings of up to 70% per launch. The SpaceX company has lowered the cost, equating to around USD 2,700 to USD 3,000 per kilogram to LEO. In contrast, traditional expendable rockets often cost more than USD 10,000 per kilogram, underscoring the financial benefits of reusability. Electron flew 21 times in 2025, and Falcon 9 surpassed 90 missions, so constellation owners can book monthly slots instead of waiting a year. Faster cadence means designers can update sensors every 18 months, keeping fleets technologically current. Lower cost per kilogram also encourages redundancy, which improves service uptime. Export-credit agencies in India and Japan finance new launch vehicles, adding global price pressure below USD 5,000 per kg. This cost efficiency reduces entry barriers for satellite operators, expedites constellation deployment, and supports growth in the small satellite market.
LEO Broadband Mega-Constellations Boom
The rapid growth of LEO broadband mega-constellations, driven by companies such as SpaceX and OneWeb, is a significant factor propelling the small satellite market. Amazon Kuiper gained a 7,727-satellite license and placed 210 craft by late 2025. SpaceX exceeded 7,000 satellites in early 2026 and earned more than USD 6 billion in annual revenue, validating the economics of direct-to-consumer services. OneWeb, with 634 satellites, targets enterprise users to sidestep consumer price wars. The first network to achieve global coverage usually wins regional distribution deals, locking customers into proprietary terminals. Regulations also matter; the US and UK licensing processes move faster than those in many other regions, giving their operators a head start. These extensive networks necessitate the deployment of hundreds to thousands of small satellites, increasing manufacturing demand, launch frequency, and downstream services, including global connectivity, particularly in underserved and remote areas.
Spectrum-licensing bottlenecks
Spectrum-licensing bottlenecks are a significant restraint on the small satellite market. Operators are required to obtain approvals from national regulators and coordinate internationally through organizations such as the International Telecommunication Union. The FCC halved its Earth-station backlog in 2025, yet coordination with federal spectrum users still takes up to two years. ITU power flux density limits hold back fleet throughput until new rules are agreed at WRC-27. Terminal makers hesitate to mass-produce V-band equipment without clear constellation timelines, slowing hardware cost reduction. Operators with earlier Ku- or Ka-band approvals, such as Starlink, enjoy a timing advantage. These processes are often lengthy and complex, and limited spectrum availability further delays constellation deployments, increases compliance costs, and creates uncertainty. This challenge is particularly pronounced for new entrants aiming for timely market access.
Other drivers and restraints analyzed in the detailed report include:
- Multi-sector demand for Earth-observation analytics
- National-security shift to proliferated LEO fleets
- Space-debris mitigation costs
For complete list of drivers and restraints, kindly check the Table Of Contents.
Segment Analysis
Earth observation expanded with a 24.71% CAGR forecast for 2026-2031, overtaking communication's dominance despite communication holding 45.25% of the small satellite market share in 2025. Planet Labs and ICEYE add high-resolution and SAR data that agriculture and insurance customers absorb in real time. The small satellite market size for Earth-observation services is propelled by analytics platforms that monetize alerts rather than raw pixels. Communication still relies on massive fleets like Starlink, but growth slows as North American consumer uptake plateaus. Analytic providers tailor products to defense, maritime, and disaster-response users, capturing higher margins.
Meanwhile, navigation payloads test LEO signals to protect against jamming. Scientific space-observation missions, though vital, remain niche due to limited funding. The application mix shows a split between high-volume consumer broadband and high-value data services, each shaping satellite design differently.
LEO accounted for 42.75% of the small satellite market size in 2025, driven by internet constellations that value low latency. MEO is projected to grow at a 24.83% CAGR because positioning, navigation, and timing missions balance coverage and survivability without requiring thousands of craft. Defense contracts such as ESS place protected communication relays in MEO to sidestep GEO latency while avoiding LEO drag. GEO operators retrofit electric propulsion and flexible payloads, yet still lose share as customers demand latency under 100 ms. Regulatory fights over scarce GEO slots push emerging nations toward LEO alternatives. Hybrid fleets mixing MEO relays with LEO user links emerge as a compromise, spreading investment risk across orbits.
Geography Analysis
North America led with a 53.77% share in 2025 due to Starlink's deployment pace and the Pentagon's spending on proliferated architecture. The Andromeda contract spreads orders across 14 companies, encouraging supply-chain diversity and competition. Rocket Lab's USD 1.85 billion backlog underlines how vertical integration secures margins despite price pressure. Canada's Telesat prepares a 298-satellite network serving polar regions, broadening continental service coverage.
Asia-Pacific is forecasted to grow at a 24.63% CAGR as China's Guowang constellation and India's NewSpace India Limited scale local manufacturing. Chang Guang Satellite Technology sells high-resolution data across Southeast Asia and Africa at aggressive prices. India expands PSLV output, letting regional startups bypass foreign launch queues. Japan leverages precision manufacturing to supply electric-propulsion components, while Australia's streamlined licensing draws ground-station investors.
Europe holds a stable 15-18% share, constrained by fragmented procurement and slower spectrum coordination. OneWeb completed its 634-satellite fleet and targets enterprise connectivity. ESA's three-satellite CO2M program supports the EU Carbon Border Adjustment Mechanism, tying Earth-observation demand to climate policy. Middle East wealth funds back domestic platforms through Western joint ventures. South America sees steady growth as Brazil's BNDES finances indigenous manufacturing, while Satellogic's Uruguay plant ships 35-kg buses for agriculture analytics.
- Space Exploration Technologies Corp.
- Airbus SE
- Lockheed Martin Corporartion
- GomSpace Group AB
- ICEYE Oy
- AAC Clyde Space AB
- OHB SE
- Surrey Satellite Technology Ltd.
- Thales Alenia Space
- L3Harris Technologies, Inc.
- Sierra Space Corporation
- Planet Labs PBC
- Northrop Grumman Corporation
- Kongsberg NanoAvionics UAB (Kongsberg Gruppen ASA)
- Blue Canyon Technologies, LLC (RTX Corporation)
- NSIL Corporation Limited
- Chang Guang Satellite Technology Co. Ltd.
- German Orbital Systems GmbH
- Satellogic Inc.
Additional Benefits:
- The market estimate (ME) sheet in Excel format
- 3 months of analyst support
TABLE OF CONTENTS
1 INTRODUCTION
- 1.1 Study Assumptions and Market Definition
- 1.2 Scope of the Study
2 RESEARCH METHODOLOGY
3 EXECUTIVE SUMMARY
4 MARKET LANDSCAPE
- 4.1 Market Overview
- 4.2 Market Drivers
- 4.2.1 Reusable-launch cost collapse
- 4.2.2 LEO broadband mega-constellations boom
- 4.2.3 Multi-sector demand for Earth-observation analytics
- 4.2.4 National-security shift to proliferated LEO fleets
- 4.2.5 Climate-compliance monitoring mandates
- 4.2.6 Export-credit support for domestic constellations
- 4.3 Market Restraints
- 4.3.1 Spectrum-licensing bottlenecks
- 4.3.2 Space-debris mitigation costs
- 4.3.3 Single-source supply of rad-hard components
- 4.3.4 Increased VLEO drag during solar maximum 25
- 4.4 Value Chain Analysis
- 4.5 Regulatory Landscape
- 4.6 Technological Outlook
- 4.7 Porter's Five Forces Analysis
- 4.7.1 Bargaining Power of Suppliers
- 4.7.2 Bargaining Power of Buyers/Consumers
- 4.7.3 Threat of New Entrants
- 4.7.4 Threat of Substitutes
- 4.7.5 Intensity of Competitive Rivalry
5 MARKET SIZE AND GROWTH FORECASTS (VALUE)
- 5.1 By Application
- 5.1.1 Communication
- 5.1.2 Earth Observation
- 5.1.3 Navigation
- 5.1.4 Space Observation
- 5.1.5 Others
- 5.2 By Orbit
- 5.2.1 Low Earth Orbit (LEO)
- 5.2.2 Medium Earth Orbit (MEO)
- 5.2.3 Geostationary Orbit (GEO)
- 5.3 By End-User
- 5.3.1 Commercial
- 5.3.2 Government and Civil
- 5.3.3 Military
- 5.4 By Satellite Mass
- 5.4.1 Femtosatellites
- 5.4.2 Picosatellites
- 5.4.3 Nanosatellites
- 5.4.4 Microsatellites
- 5.4.5 Minisatellites
- 5.5 By Geography
- 5.5.1 North America
- 5.5.1.1 United States
- 5.5.1.2 Canada
- 5.5.1.3 Mexico
- 5.5.2 Europe
- 5.5.2.1 United Kingdom
- 5.5.2.2 France
- 5.5.2.3 Germany
- 5.5.2.4 Russia
- 5.5.2.5 Rest of Europe
- 5.5.3 Asia-Pacific
- 5.5.3.1 China
- 5.5.3.2 India
- 5.5.3.3 Japan
- 5.5.3.4 South Korea
- 5.5.3.5 Rest of Asia-Pacific
- 5.5.4 South America
- 5.5.4.1 Brazil
- 5.5.4.2 Rest of South America
- 5.5.5 Middle East and Africa
- 5.5.5.1 Middle East
- 5.5.5.1.1 Saudi Arabia
- 5.5.5.1.2 United Arab Emirates
- 5.5.5.1.3 Rest of Middle East
- 5.5.5.2 Africa
- 5.5.5.2.1 South Africa
- 5.5.5.2.2 Rest of Africa
- 5.5.5.1 Middle East
- 5.5.1 North America
6 COMPETITIVE LANDSCAPE
- 6.1 Market Concentration
- 6.2 Strategic Moves
- 6.3 Market Share Analysis
- 6.4 Company Profiles (includes Global level Overview, Market level overview, Core Segments, Financials, Strategic Information, Market Rank/Share, Products and Services, and Recent Developments)
- 6.4.1 Space Exploration Technologies Corp.
- 6.4.2 Airbus SE
- 6.4.3 Lockheed Martin Corporartion
- 6.4.4 GomSpace Group AB
- 6.4.5 ICEYE Oy
- 6.4.6 AAC Clyde Space AB
- 6.4.7 OHB SE
- 6.4.8 Surrey Satellite Technology Ltd.
- 6.4.9 Thales Alenia Space
- 6.4.10 L3Harris Technologies, Inc.
- 6.4.11 Sierra Space Corporation
- 6.4.12 Planet Labs PBC
- 6.4.13 Northrop Grumman Corporation
- 6.4.14 Kongsberg NanoAvionics UAB (Kongsberg Gruppen ASA)
- 6.4.15 Blue Canyon Technologies, LLC (RTX Corporation)
- 6.4.16 NSIL Corporation Limited
- 6.4.17 Chang Guang Satellite Technology Co. Ltd.
- 6.4.18 German Orbital Systems GmbH
- 6.4.19 Satellogic Inc.
7 MARKET OPPORTUNITIES AND FUTURE OUTLOOK
- 7.1 White-space and Unmet-need Assessment

